We Teach Trading — Zero Tips, Zero Advice, Zero Recommendations. Not registered with SEBI or any financial regulator worldwide.
We Teach Trading — Zero Tips, Zero Advice, Zero Recommendations. Not registered with SEBI or any financial regulator worldwide.
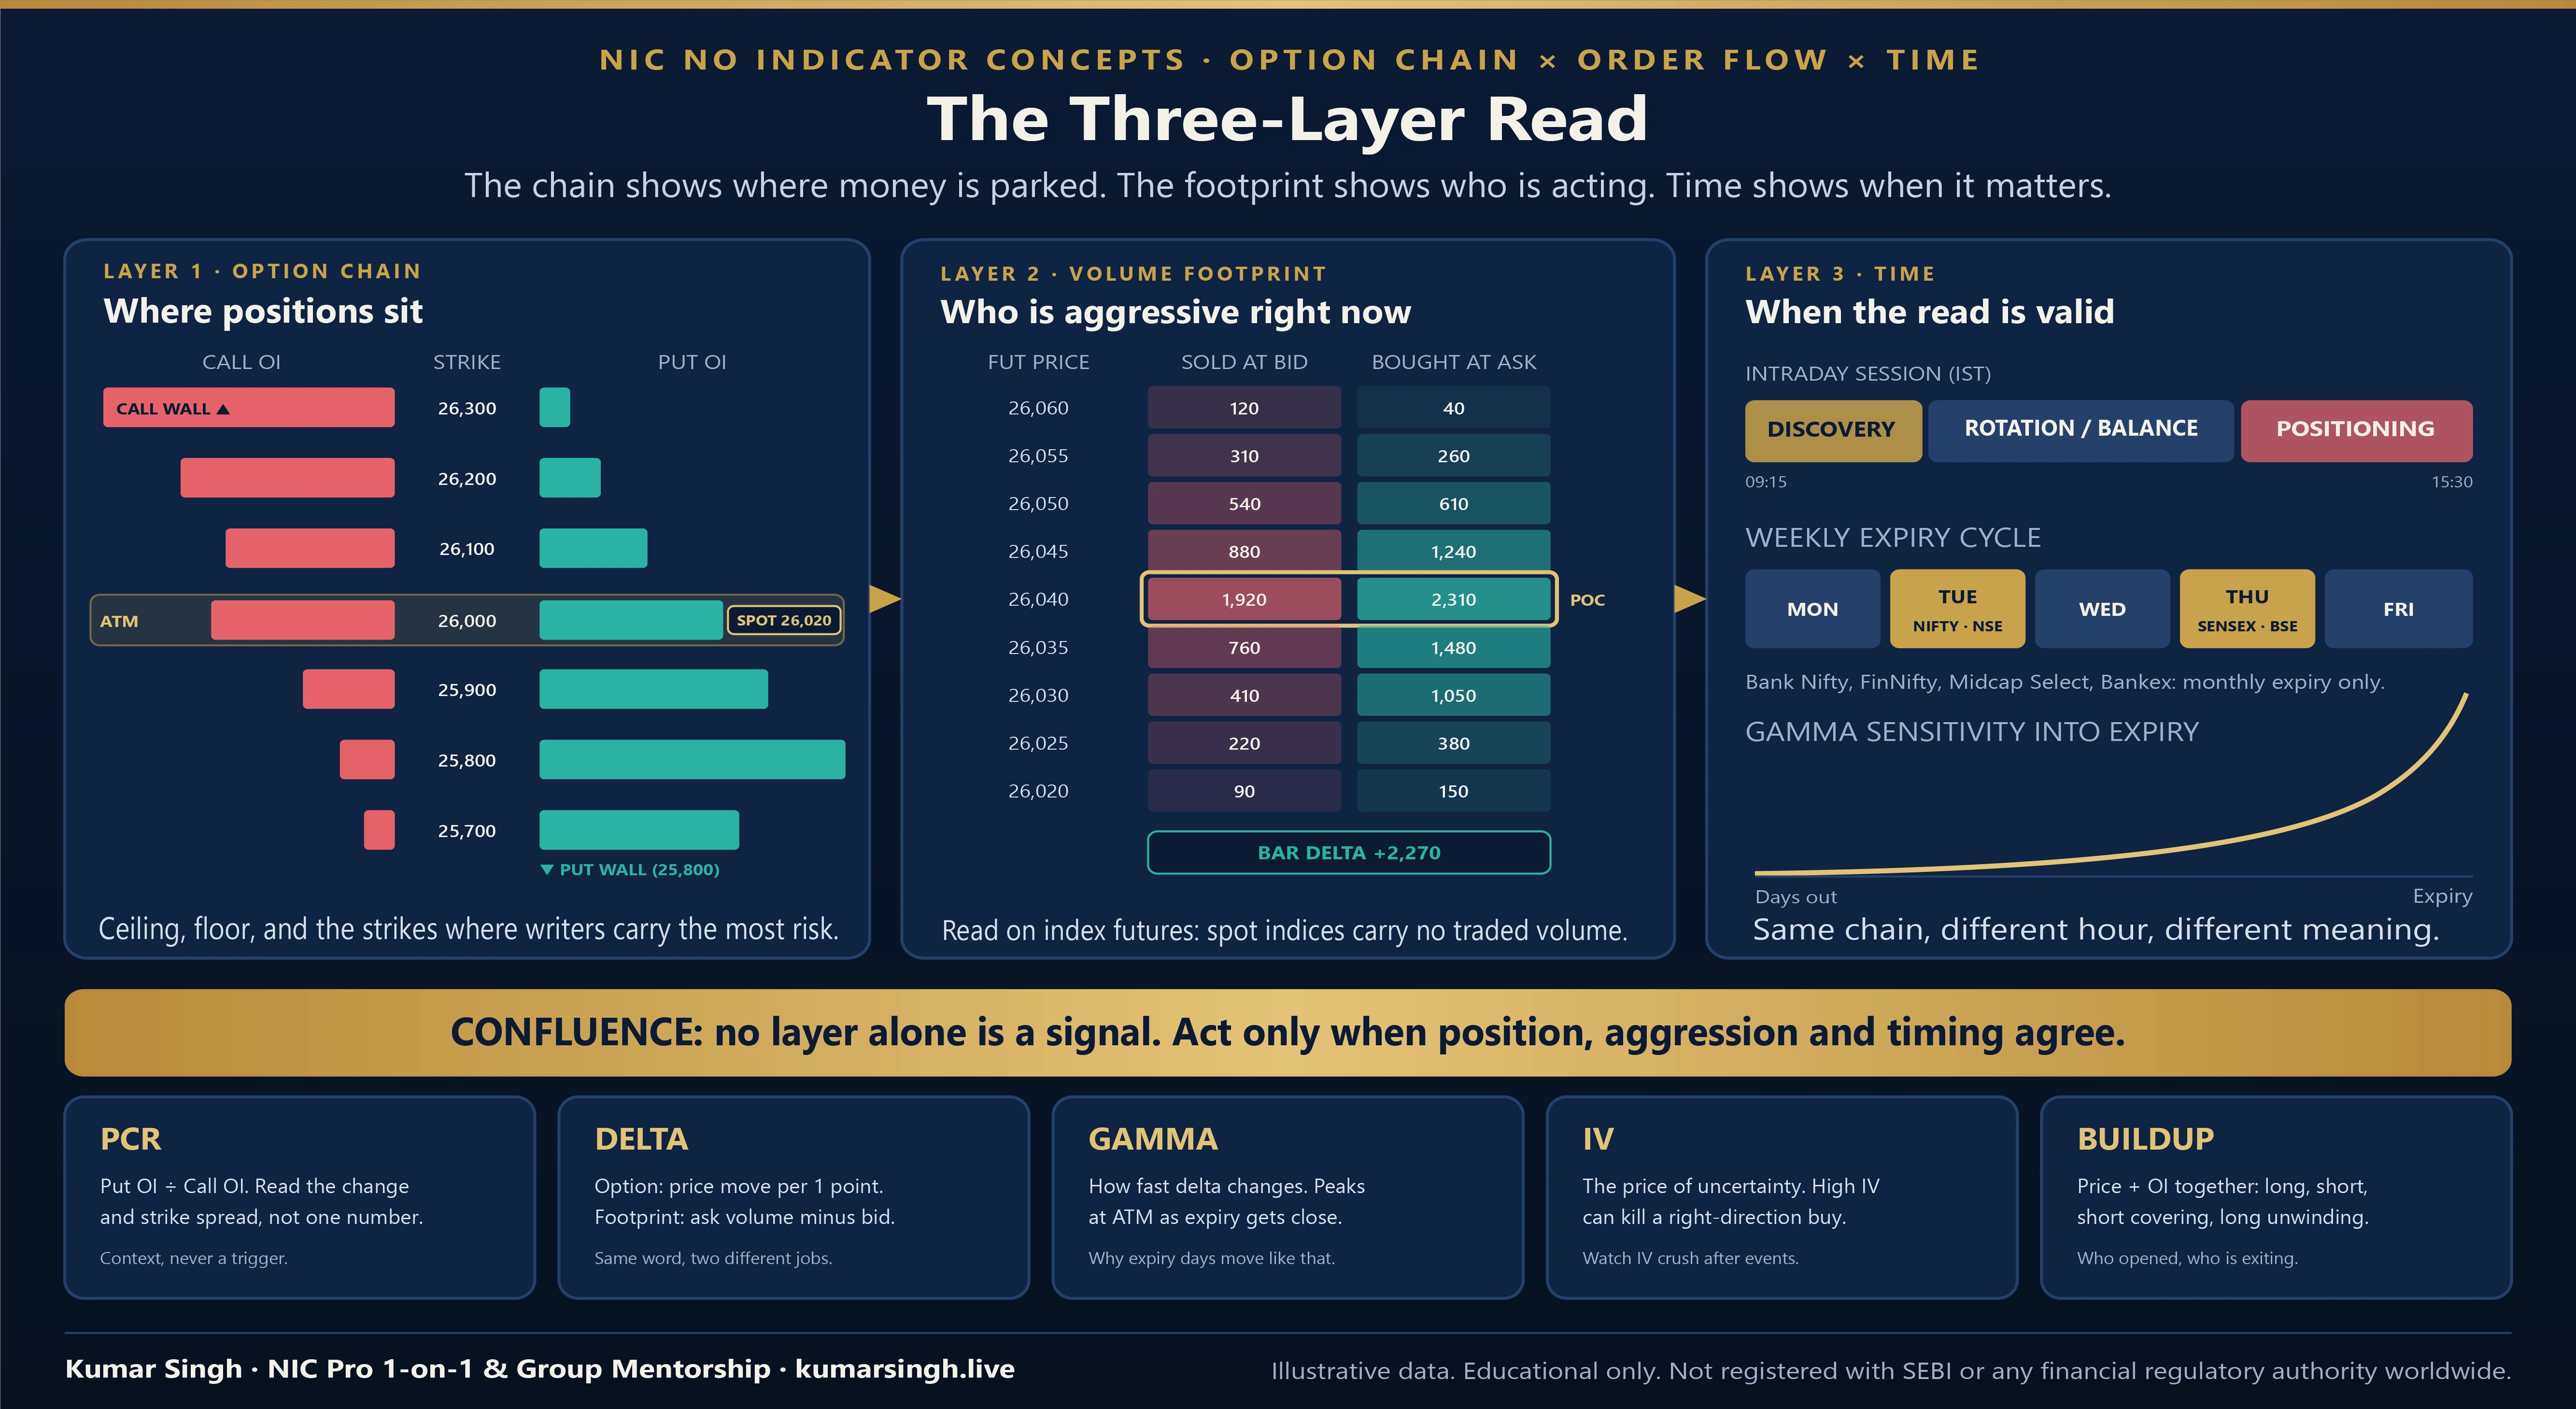
How Indian F&O traders should read OI, PCR, the Greeks, IV and buildup together with the volume footprint. For Nifty, Bank Nifty, Sensex, FinNifty, Midcap Select, Bankex and stock options.
Most F&O traders treat the option chain as a buy or sell signal. It is a map of where money is parked. Learn how OI, PCR, delta, gamma, IV and buildup work with the volume footprint to show who is acting and when, for Nifty, Bank Nifty, Sensex, FinNifty, Midcap Select, Bankex and stock options.
An option chain is the live table of every call and put strike for one underlying and one expiry. Each strike shows premium, bid and ask, volume, open interest (OI), change in OI and implied volatility (IV).
It shows positioning. Where contracts are open. Where option writers carry the most risk. Where that risk is moving during the day.
It does not show aggression or timing. OI cannot tell you who initiated a trade or whether buyers are winning right now. That is the job of order flow and the volume footprint.
PCR, delta, gamma, IV and buildup are context. Each one answers a narrow question. None of them is an entry signal on its own.
In NIC, I read three layers together: the chain (where), the footprint (who) and time (when). Figure 1 shows the idea.
My rule after three decades on screen: the chain tells you where the fight is likely to happen. The footprint tells you who is winning it right now. Trade only when both agree, at the right time. |
Most Indian platforms follow the NSE layout. Calls on the left, puts on the right, strike prices in the middle. Here is what each column means and how I treat it.
Column | What it is | How I use it |
Strike | The price at which the option can be exercised | Locate ATM first, then read 5 to 10 strikes on each side |
LTP | Last traded premium | Check it against bid and ask. A stale LTP on a thin strike lies |
Bid / Ask | Best buyer and best seller with quantity | The spread is your hidden cost. Wide spread, smaller size or skip |
Volume | Contracts traded today | Activity. Says nothing about whether positions stayed open |
OI | Contracts still open | Commitment. Money that chose to stay in the trade |
Change in OI | OI added or removed today | Fresh positioning. More useful intraday than total OI |
IV | Volatility implied by the premium | Tells you if the premium is expensive or cheap for that strike |
ATM (at the money): the strike nearest to the current price. Some traders use spot, some use futures. Be consistent.
ITM (in the money): a call strike below price, or a put strike above price. It carries intrinsic value.
OTM (out of the money): a call strike above price, or a put strike below price. Pure time value.
Units matter: some platforms show OI in contracts, others in quantity (lots multiplied by lot size). Know which one you are looking at before comparing numbers across platforms.
Volume counts every trade. OI counts only the positions that remain open. One trade can move OI up, down, or not at all.
Buyer is | Seller is | Effect on OI |
Opening a new long | Opening a new short | OI rises by the traded quantity |
Closing an old short | Closing an old long | OI falls by the traded quantity |
Opening a new long | Closing an old long | OI unchanged (position changed hands) |
Closing an old short | Opening a new short | OI unchanged (position changed hands) |
High volume, flat OI: intraday churn. Traders passing positions to each other.
High volume, rising OI: fresh money committing to a view. Pay attention.
Falling OI on a rally or fall: positions are being closed. The move is running on exits, not new conviction.
Speed: on most retail platforms OI updates in intervals, not on every trade. A footprint updates on every trade. That speed gap is one reason order flow traders use the chain as a map, not as a trigger.
Buildup combines price change with OI change. It is cleanest on futures. Read it there first.
Price | OI | Buildup | What it usually means |
Up | Up | Long buildup | Fresh buyers entering. Trend has new fuel |
Down | Up | Short buildup | Fresh sellers entering. Pressure is building |
Up | Down | Short covering | Shorts exiting. Rallies can be fast but lack new fuel |
Down | Down | Long unwinding | Longs exiting. Weakness from exits, not fresh shorts |
On option contracts, apply the same logic to the option premium itself. But theta pulls every premium down daily. Near expiry, falling premium with rising OI is often writing, not panic.
Call OI rising at a strike above price is commonly read as call writing, a ceiling view.
Put OI rising at a strike below price is commonly read as put writing, a floor view.
The honest limit: OI alone never tells you whether a buyer or a writer added the position. A put OI jump can be an institution buying protection. Premium behaviour and the footprint close that gap. This is the first place order flow earns its seat next to the chain.
OI PCR = total put OI ÷ total call OI for that expiry.
Volume PCR = total put volume ÷ total call volume for the day.
Example: put OI of 96 lakh contracts and call OI of 80 lakh contracts gives a PCR of 1.2.
Option writing in Indian indices is dominated by well-capitalised participants. So rising put OI is usually read as put writers defending lower levels, and a rising PCR is read as supportive.
A falling PCR is read as call writers gaining control above price.
Extremes flip. A very high PCR can mean one side is crowded. A very low PCR can mean the opposite. No fixed number works across Nifty, Bank Nifty and Sensex, or across weekly and monthly expiries.
Change in PCR intraday, not the absolute value.
Strike-wise PCR around ATM (roughly five strikes either side), where the real fight is.
Compare like with like: weekly with weekly, monthly with monthly.
Expiry day: OI collapses as positions close or settle, and the ratio swings wildly.
Hedges: put OI includes protection bought against long portfolios. That is not writing.
Far OTM noise: cheap deep OTM strikes inflate totals without telling you much.
Where I stand: PCR is context. I have never taken a trade because PCR crossed a number, and I do not teach it that way. |
Definition: change in option premium for a 1-point move in the underlying.
Range: calls 0 to +1. Puts 0 to −1. ATM is close to ±0.5. Deep ITM moves toward ±1, deep OTM toward 0.
Example: a Nifty call with delta 0.45. Nifty rises 40 points. Premium rises about 18 points, other Greeks ignored. On one lot of 65, that is about ₹1,170.
Position delta = delta × lot size × number of lots. This is your real directional exposure, in index points.
Rough probability: delta is often used as a rough estimate of the chance of expiring ITM. Useful shorthand. Not an exact probability.
Same word, two jobs. Option delta measures premium sensitivity. Footprint delta is ask volume minus bid volume, a measure of aggression. Mixing them up is one of the most common errors I see in traders who come to me from YouTube. |
Definition: change in delta for a 1-point move in the underlying.
Highest at ATM and rises sharply as expiry gets close.
Option buyers are long gamma. Delta grows in their favour as price moves their way.
Option writers are short gamma. Losses accelerate when price runs against them.
Why Nifty Tuesdays and Sensex Thursdays move the way they do: ATM options with hours left carry extreme gamma. A 0.5 delta can turn into 0.9 or 0.1 in one leg.
A caution on GEX maps: gamma exposure models were built around US dealer hedging, where market makers delta-hedge their books. The participant mix in Indian options is different. Treat GEX levels here as a hypothesis, not a fact.
Definition: premium lost per day from time decay, all else equal.
Negative for buyers, positive for writers.
Decay accelerates into expiry and is largest in rupee terms for ATM strikes.
Buying a weekly option one session before expiry means paying for speed. If the move does not come quickly, theta collects.
Definition: premium change for a 1-point change in IV.
Larger for ATM and longer-dated options. Smaller for near-expiry options.
A buyer can be right on direction and still lose if IV drops more than the move adds.
IV is backed out of the option premium using a pricing model. It is the market’s price for expected movement.
India VIX is NSE’s volatility index, computed from Nifty option prices. It expresses expected annualised volatility over the next 30 calendar days.
Rough daily range from VIX: VIX ÷ √365 gives an approximate one-day, one-standard-deviation move in percent. VIX 13 gives about 0.68%. At Nifty 26,000, that is roughly 177 points. A guide, not a promise.
IV crush: IV rises before scheduled events like the Union Budget, RBI policy, election results and, for stock options, quarterly results. It usually falls once the event is out. Buyers who pay peak IV need a large move just to break even.
Skew: in Indian indices, OTM puts usually trade at higher IV than equally distant OTM calls, because downside protection is in demand. Compare IV across strikes, not one number.
My working rule: compare current IV with its own recent range for the same underlying before buying premium.
Strike type | Typical delta | Premium | Theta and gamma | Fits | Main risk |
ITM | 0.60 to 0.90 | High | Lower time value share | Directional view with less decay | More capital per lot |
ATM | About 0.50 | Medium | Highest theta and gamma | Fast moves with good timing | Decay if timing is off |
OTM | Below 0.40 | Low | All time value | Large, quick moves only | Expires worthless often |
Define the expected move and the time window first. From structure and order flow. Not from hope.
Match delta to the move. A 0.20 delta option needs a large move, and fast.
Check liquidity. Tight bid-ask, healthy volume and OI at that exact strike. Wide spreads eat your edge before the trade starts.
Check IV against its own range. Expensive premium needs a bigger move to pay.
Check the OI walls between price and your target. Buying a call into the heaviest call-writing strike asks the market to break its strongest ceiling.
Size by rupee risk, not by lots. Risk per lot = premium risk × lot size. Current lot sizes: Nifty 65, Bank Nifty 30, FinNifty 60, Nifty Midcap Select 120, Nifty Next 50 at 25 (NSE, revised from January 2026), Sensex 20 and Bankex 30 (BSE). Exchanges review these periodically. Confirm before you trade.
Choose the expiry deliberately. Weekly (Nifty, Sensex) for speed. Monthly for room to be wrong for a while.
Cheap is not value. A ₹5 option that expires at zero is a 100% loss. Price tells you nothing about probability. Delta and the chain do. |
Max pain is the strike at which total payout to option buyers would be lowest at expiry. It is calculated by assuming settlement at each strike in turn and adding up the intrinsic value of every call and put, weighted by OI. The strike with the smallest total is max pain.
OI walls are strikes with the heaviest call or put OI. They act as reference ceilings and floors.
Pinning near heavy OI does happen on quiet expiries. Trending days and news days break walls without asking.
The shift matters more than the wall. When call OI falls at 26,000 and builds at 26,200, the ceiling has been moved up. I watch walls migrate, not sit.
It lags. OI updates in intervals. Price moves every tick.
It has no aggressor information. OI cannot tell you who hit the bid or lifted the offer.
It is coarse. Strikes sit 50 or 100 points apart. Real decisions happen between strikes.
It mixes hedges with views. Big OI can be insurance, not conviction.
It invites reaction trading. Refreshing the NSE chain and buying every time PCR changes is reacting to a snapshot of positions, not reading the auction.
Order flow is the record of market orders hitting resting limit orders. A volume footprint chart splits every candle into price rows and shows how much traded at the bid (sellers hitting) and at the ask (buyers lifting) on each row.
Footprint concept | What it shows |
Delta | Ask volume minus bid volume for a row, a bar or a session. Net aggression |
Cumulative delta | Running total of delta. Who has been more aggressive over time |
POC (point of control) | The price row with the most volume in a bar or session. Where business was done |
Imbalance | One side heavily outweighing the other across adjacent rows |
Absorption | Heavy aggression on one side with little price progress. Passive orders soaking it up |
Exhaustion | Aggression drying up at a high or low |
Spot indices have no traded volume. Nifty, Bank Nifty and Sensex spot are calculated values. Read the footprint on the index futures, or on the option contract itself.
Stocks: read the cash stock or its futures. Check which one gives the cleaner, deeper volume for that stock.
Data quality decides everything. Several retail broker feeds send periodic snapshots rather than every trade. A footprint is only as honest as its feed. Check your vendor before you trust any delta number.
This is how the pieces fit in NIC. The rules that turn it into entries stay in live mentorship. The logic is public, and it is below.
Where OI is heaviest. Where it is shifting. What buildup says on futures. Whether IV is expensive.
Whether real participation shows up when price reaches a level the chain marked.
Illustration: Nifty futures reach a strike carrying heavy call writing. If aggressive buying keeps hitting the offer but price cannot progress, writers are defending. If aggression keeps lifting offers and call OI at that strike starts dropping, short covering may follow. Same level. Opposite stories. The chain alone cannot tell them apart.
Session phase: the opening discovery, the mid-session rotation and the closing positioning each carry different weight.
Days to expiry: the same OI picture means one thing six sessions out and something else on expiry morning.
Event calendar: RBI policy, Budget, results and global data change IV and positioning before they change price.
In NIC Pro this layer is formalised through TimeFold, my candle and volume footprint anatomy framework. Its rules are taught live only.
Confluence, not signals. Position without aggression is a guess. Aggression without position is noise. Both without timing is early or late. |
Instrument | Exchange | Expiry (Oct 2026) | Lot size | What I watch |
Nifty 50 | NSE | Weekly: Tuesday. Monthly: last Tuesday | 65 | Deepest chain in India. Weekly gamma dominates Monday and Tuesday |
Bank Nifty | NSE | Monthly only: last Tuesday | 30 | Heavy weight of a few large banks. Check their own flows |
FinNifty | NSE | Monthly only: last Tuesday | 60 | Overlaps Bank Nifty. Thinner chain, check spreads |
Nifty Midcap Select | NSE | Monthly only: last Tuesday | 120 | Thinner liquidity. Wider spreads away from ATM |
Sensex | BSE | Weekly: Thursday. Monthly: last Thursday | 20 | Second weekly expiry of the week. Activity bunches close to expiry |
Bankex | BSE | Monthly only: last Thursday | 30 | Thin chain. Liquidity first, view second |
Stock options | NSE | Monthly: last Tuesday | Varies by stock | Physically settled. IV crush around results. F&O ban when futures-equivalent OI crosses 95% of MWPL |
If an expiry day is a trading holiday, expiry moves to the previous trading day.
Stock options are physically settled. An ITM stock option held into expiry can create a delivery obligation. Know this before holding into the last day.
Index options are cash-settled.
OI collapses as positions close. PCR and OI walls lose reliability through the session.
Gamma is extreme. ATM premiums can triple or go to zero within an hour.
Theta is brutal for buyers who are early.
SEBI’s index derivatives measures, phased in from November 2024: weekly expiry on only one benchmark index per exchange and an extra 2% extreme loss margin on short options on expiry day (from 20 November 2024), then upfront collection of option premium from buyers and no calendar spread margin benefit on expiry day (from early 2025).
Expiry trading needs more confirmation from order flow, not less.
Treating PCR as a buy or sell signal.
Reading total OI instead of change in OI.
Buying deep OTM options because they are cheap.
Buying premium into an event at peak IV.
Ignoring bid-ask spread on thin strikes.
Confusing option delta with footprint delta.
Looking for volume on a spot index chart.
Assuming every OI addition is writing.
Holding ITM stock options into expiry without understanding physical settlement.
Sizing by number of lots instead of rupee risk.
Check | Question to answer | Move forward only when |
Position | Where are the heaviest call and put OI strikes? | You know the ceiling and floor for this expiry |
Shift | Is OI migrating up or down today? | Direction of the shift is clear, or you stand aside |
Buildup | What do futures price and OI say? | Buildup does not contradict your view |
IV | Is IV high or low against its own range? | Premium cost fits the move you expect |
Strike | Is the strike liquid, with the right delta? | Spread is tight and delta matches the move |
Aggression | Does the footprint confirm participation at the level? | Order flow agrees with the chain |
Time | Session phase, days to expiry, events? | Timing supports the trade |
Risk | What is the rupee risk per lot and in total? | Loss is acceptable before entry |
SEBI’s study of FY26 found that 87.7% of individual equity derivatives traders made net losses, with aggregate net losses of about ₹91,685 crore.
Options trading accounted for about 92% of aggregate individual losses.
Active individual traders fell to about 87.5 lakh in FY26, roughly 18% fewer than in FY25.
In my experience, most of those losses share the same roots: buying options without reading positioning, IV or timing, and sizing too big.
Indicators are formulas applied to past price. RSI, MACD, moving averages. Derived, smoothed, late.
OI, volume, bid and ask, and IV are records of actual market activity. They are raw data, not formulas on price. That is why they sit inside a no-indicator approach.
I have read markets this way since 1994. I never took a trading course. NIC came out of screen time, losses, notes and years of testing.
The promise has not changed: Pure Structure. Real Markets. Zero Indicators.
Reading the option chain as an order flow trader, strike by strike.
The Greeks and IV in live Indian market conditions, not textbook examples.
Volume footprint anatomy on index futures, options and stocks.
Market structure without indicators, the NIC way.
TimeFold, for reading candles and footprints in their time context.
My Institutional Order Flow & Volume Footprint 1-2-3 Formula conditions.
My framework for combining option chain data with footprint readings.
TimeFold rules, entry and exit conditions, and risk specifics.
These are taught verbally, live, inside NIC Pro only. You will not find them in a video, a PDF on the internet or this article.
NIC Pro 1-on-1 Mentorship | NIC Pro Group Mentorship | |
Format | Private live sessions with me, online | Live sessions with a group of traders, online |
Pace | Set around your schedule and gaps | Structured cohort pace |
Focus | Your instruments, your trades, your mistakes | Shared curriculum with live examples |
Best for | Traders with specific gaps or tight schedules | Traders who learn well alongside others |
Lifetime Mentorship Support is available as an add-on at enrolment only. It cannot be added later.
You already trade or study F&O and want to understand why price moves, not only where.
You use, or plan to use, order flow and footprint charts and want the option chain to fit into that read.
You will journal, review and accept feedback.
Anyone looking for tips, calls or signals. I do not give them.
Anyone expecting guaranteed returns. Nobody honest can promise that.
Anyone trading money they cannot afford to lose.
To start: visit kumarsingh.live, write to ksingh@kumarsingh.live, or call +91 9999866089. I reply personally.
Term | Meaning |
ATM / ITM / OTM | At, in or out of the money, relative to current price |
Open interest (OI) | Number of contracts still open |
Change in OI | OI added or removed during the session |
PCR | Put-call ratio: put OI ÷ call OI (or volumes) |
Delta (option) | Premium change per 1-point move in the underlying |
Gamma | Change in delta per 1-point move |
Theta | Premium lost per day from time decay |
Vega | Premium change per 1-point change in IV |
IV | Implied volatility, the volatility priced into the premium |
India VIX | NSE’s 30-day expected volatility index from Nifty options |
Buildup | Combined reading of price change and OI change |
Max pain | Strike where total payout to option buyers is lowest at expiry |
Footprint | Chart showing bid and ask volume at each price inside each candle |
Delta (footprint) | Ask volume minus bid volume |
POC | Point of control, the price with the highest traded volume |
MWPL | Market-wide position limit for a stock in F&O |
Kumar Ravishanker Singh, professionally known as Kumar Singh, is an independent trader, trading mentor and independent technical researcher based in India. He has read markets independently since 1994 and built NIC (No Indicator Concepts) from his own screen time, without taking any trading course. He is the founder and director of Kumar Singh Global Trading Academy (OPC) Private Limited, which runs NIC Pro 1-on-1 and Group Mentorship online for traders worldwide.
YouTube @kumarsingh · X @kumarsinghlive · Instagram and Facebook @kumarsinghtrader · kumarsingh.live
Kumar Singh and Kumar Singh Global Trading Academy (OPC) Private Limited are not registered with SEBI or any financial regulatory authority worldwide. This article is for education only. It is not investment advice, research, a recommendation or a solicitation to buy or sell any security or derivative. No tips, calls or signals are given here or in NIC Pro. All examples, figures and strikes are illustrative. Futures and options trading carries a high risk of loss, and SEBI’s own studies show most individual traders lose money. Past performance does not guarantee future results. Consult a SEBI-registered investment adviser before making financial decisions. NIC, NIC Pro and Kumar Singh are trademarks of Kumar Singh Global Trading Academy (OPC) Private Limited. Proprietary methods named here are protected and taught only inside live mentorship.
Straight answers on PCR, delta, gamma, IV, max pain, strike selection and expiry days for Nifty, Bank Nifty, Sensex and stock options, plus how order flow fits in.
Reading call and put data across strikes for one underlying and expiry, mainly OI, change in OI, volume, IV and premium, to understand where traders are positioned and where writers carry risk.