We Teach Trading — Zero Tips, Zero Advice, Zero Recommendations. Not registered with SEBI or any financial regulator worldwide.
We Teach Trading — Zero Tips, Zero Advice, Zero Recommendations. Not registered with SEBI or any financial regulator worldwide.
Most traders blame their entries. The real problem is how they read the market. Here is what order flow analysis actually exposes — and where analytical traders go wrong before a single trade is placed.
I have been watching markets since 1994. And in all those years across thousands of hours of mentoring students from Finland to Kuwait, from Mumbai to London, one pattern repeats itself without exception.
The trader is not losing because of bad luck. The trader is losing because they are misreading the information the market is already giving them.
Order flow is that information. And most traders are getting it wrong in the same five ways.
This is not theory. This is what I see on footprint charts, in volume profiles, and in the behavioral data of every market, every session, every day. When you understand where the mistakes are, you begin to see the market the way institutional participants do: as a record of decisions, not a collection of candles.
Let me walk you through each mistake - and what it actually means for how you should be reading structure.
This is the most common and most destructive misread in order flow analysis.
Traders are taught to look for volume to "confirm" a move. High volume on a breakout means the move is real. High volume on a rejection means the level holds. This sounds logical. It is incomplete.
Volume does not confirm direction. Volume tells you where the market transacted, and how much effort was required to move price through that level. These are two entirely different things.
When you see a large volume candle, the first question is not "is this bullish or bearish?" The first question is: what did price do after this volume printed?
If price moved significantly with large volume, effort and result are aligned. The market accepted the move.
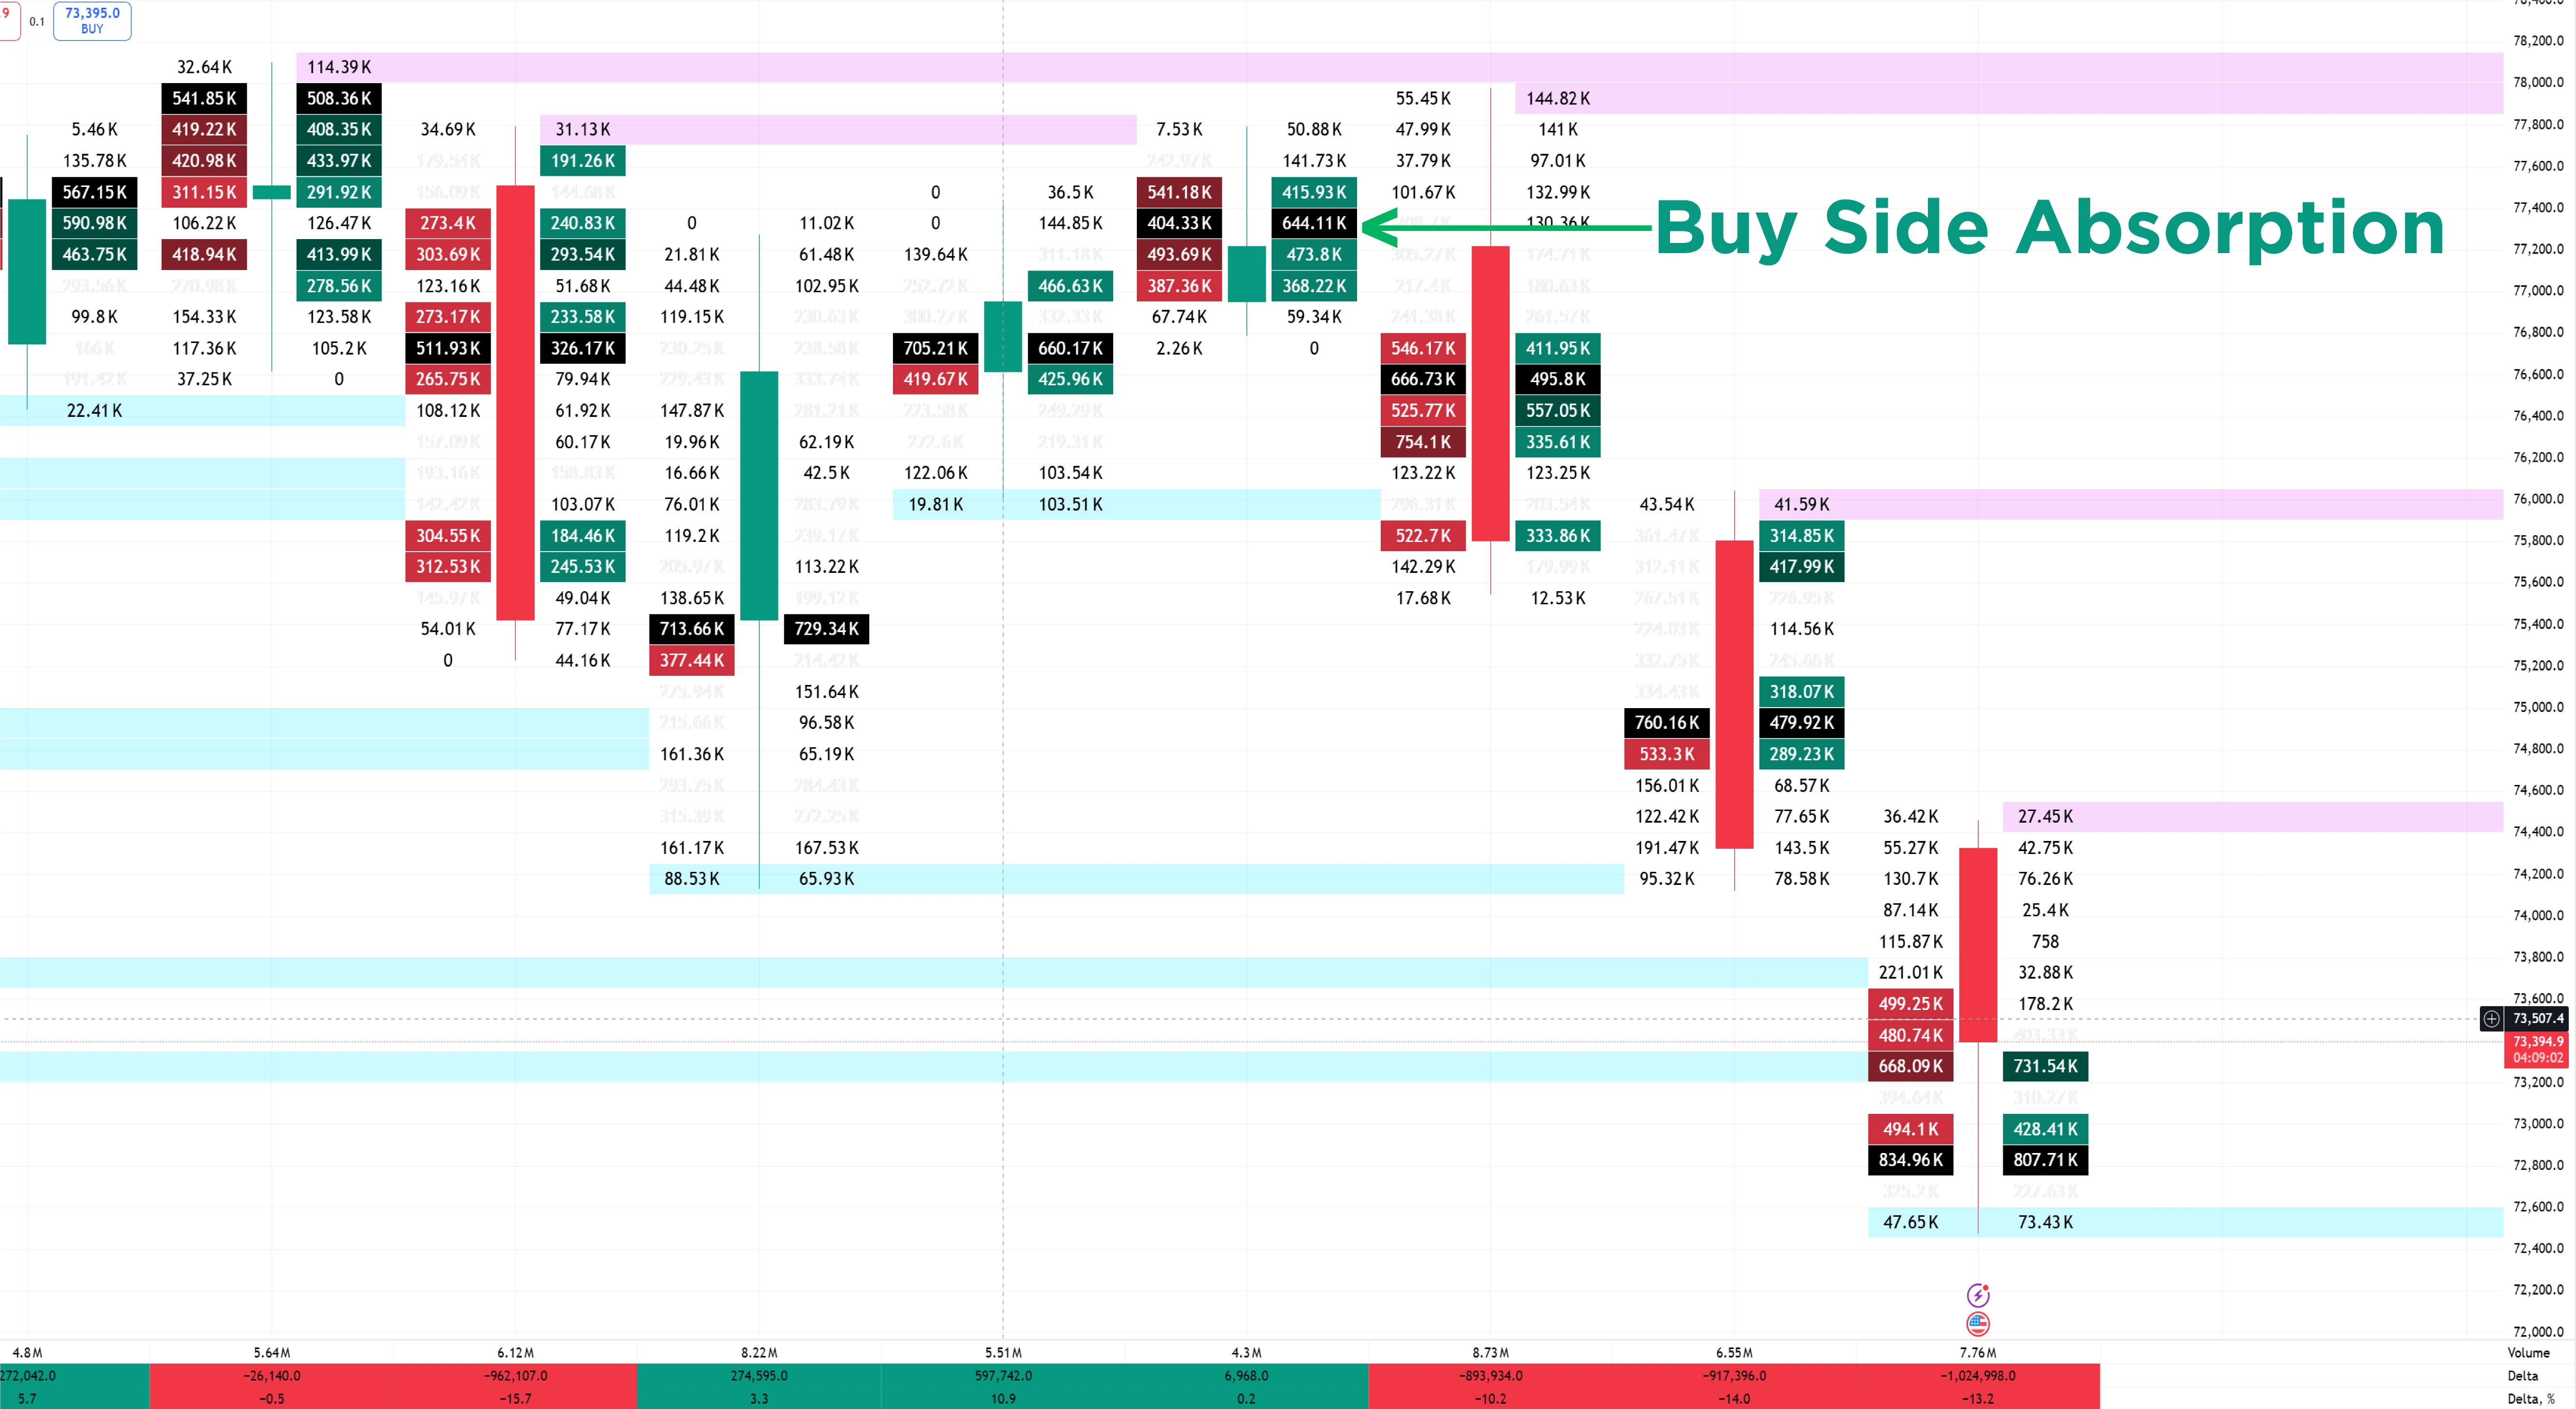
If price barely moved despite significant volume, the market absorbed that aggression and went nowhere. That is not strength. That is absorption. And absorption almost always precedes reversal.
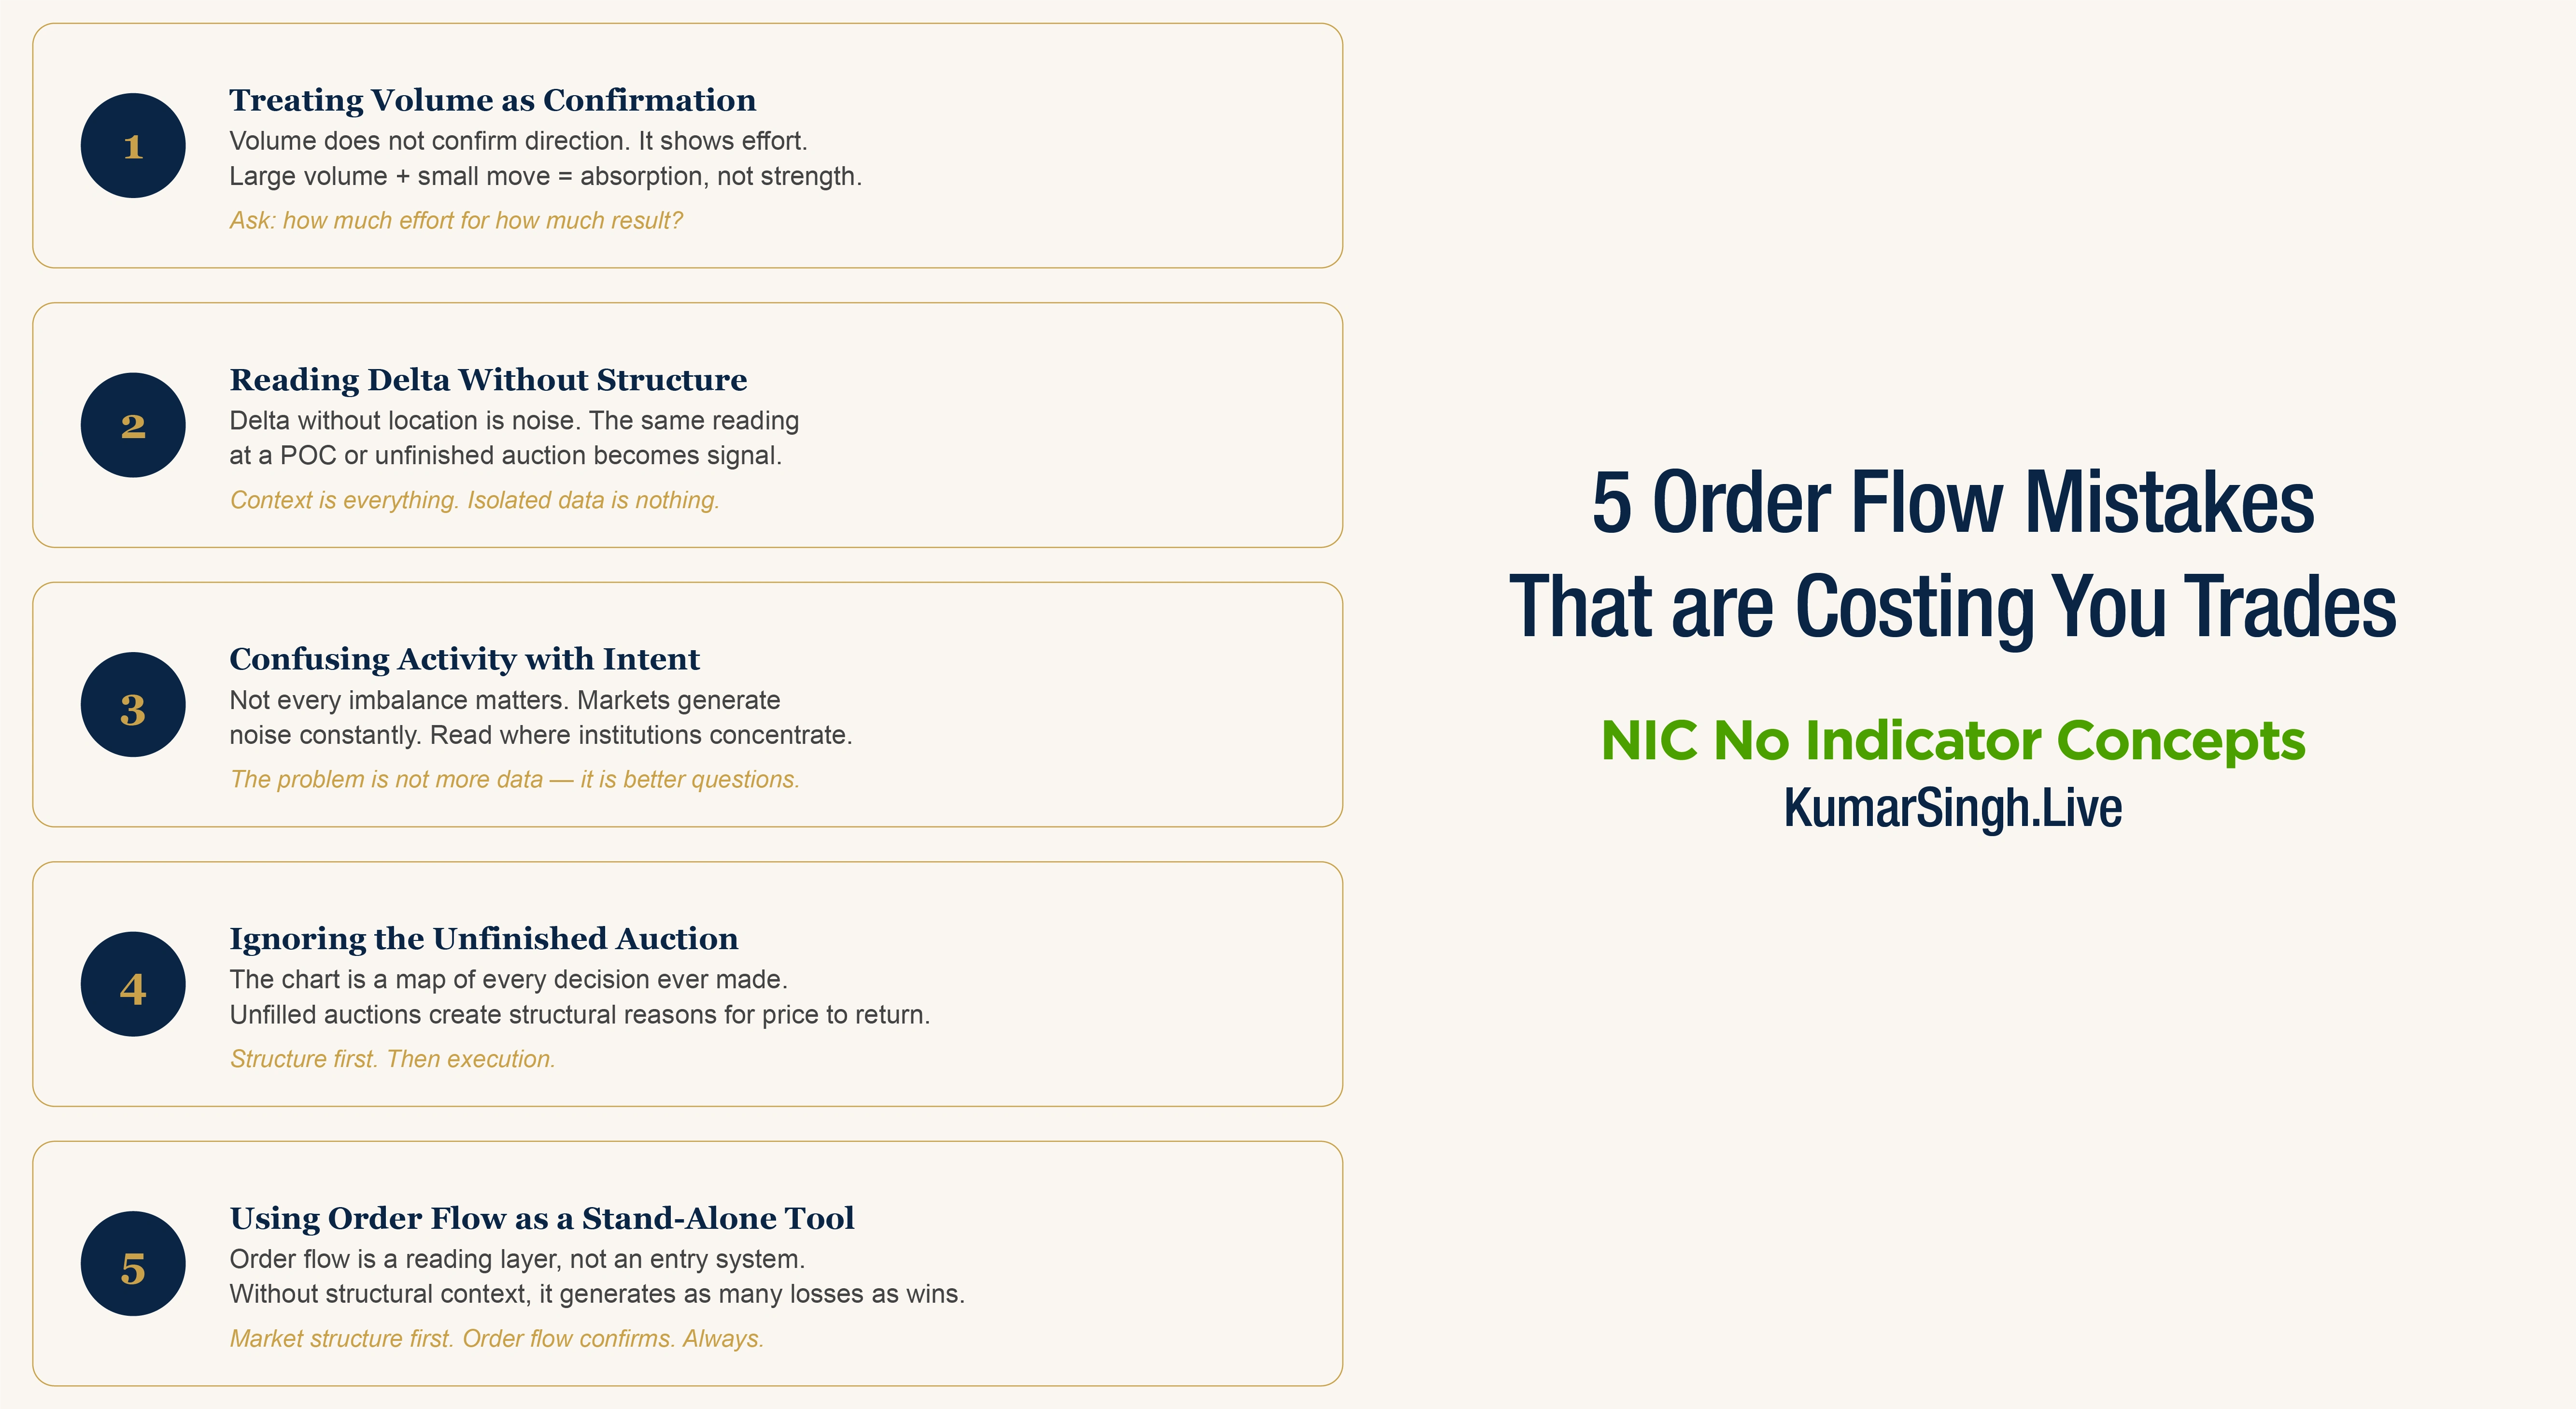
In the NIC framework, we read volume as a story of participation. The question is never just "how much." The question is always "how much effort for how much result?" That relationship is where the real information lives.
Delta is the difference between aggressive buying and aggressive selling at each price level. Most traders who use footprint charts treat delta as a directional signal, positive delta means buyers are in control, negative delta means sellers are winning.
This is a surface-level reading that misses the deeper logic.
Delta tells you who was aggressive in initiating trades. It does not tell you who was positioned, who was absorbing, or where the trapped participants are. A candle with strongly positive delta that fails to close above a significant volume node is not bullish confirmation. It is a warning. The buyers were aggressive, but they could not move price through supply. That aggressiveness has now created a position that may need to be liquidated.
That liquidation, when it comes, is the move.
This is what the NIC approach to volume footprint teaches: read delta in context of where it printed, not in isolation. A delta number without a structural location is noise. The same delta reading at a Point of Control, at an unfinished auction, or at an institutional reference level becomes signal.
Context is everything. Isolated data is nothing.
Markets are loud. Footprint charts are visually dense. And most traders, particularly those new to order flow, make the mistake of treating all activity as meaningful.
Not every imbalance matters. Not every volume spike is a setup. Not every delta shift is a signal.
The market generates noise constantly. The auction process involves participants entering, exiting, hedging, rolling, and rebalancing positions, most of which has nothing to do with the directional move you are trying to read.
The analytical trader's job is not to react to everything. It is to identify where institutional order flow is concentrated, where price has left unfinished business, and where the market's own structure creates a high-probability next move.
In my years of teaching this framework, I call this the signal-to-noise problem. And it is not solved by adding more data. It is solved by asking better questions.
Better questions: Where has the market spent significant time and volume? Where has it moved through quickly, leaving unfilled business behind? Where are participants likely to be trapped, and what will they do when price returns?
These are structural questions. They are answered by price and volume, and nothing else.
This is the mistake I spend the most time correcting in mentorship, and it is the one that, once understood, changes how a trader sees the entire chart.
Markets are auction processes. The auction's job is to facilitate trade. When the auction fails to reach a level where sufficient participation exists, it leaves behind what practitioners call an unfinished auction, a price area the market will almost certainly revisit.
Most traders ignore this completely. They look at where price is now. They read the current candle's delta. They place a trade based on what they see at this moment.
But the chart is not just the present moment. The chart is a map of every decision made by every participant, and that map contains unfilled auctions, price locations the market left without completing its job.
Understanding where the unfinished business is gives you something that indicators cannot: a structural reason for why price is likely to move in a particular direction. Not because a line crossed, not because a pattern appeared, because the market's own mechanics demand it returns to complete the auction.
This is a core principle in the NIC framework. We do not predict direction based on patterns. We read the market's unfinished business and position accordingly.
I will be direct about this: order flow analysis is not a standalone entry system. It is a contextual reading layer.
I see traders who have learned footprint charts, who understand delta, who can identify volume clusters, and who are still losing. When I examine their approach, the reason is almost always the same: they are using order flow in isolation, divorced from the market's higher-timeframe structure.
Order flow at a random price level is different from order flow at a significant institutional reference level. A volume imbalance inside a balanced market is different from the same imbalance at the edge of a prior auction range. Delta divergence on a minor swing low is different from the same divergence at a critical structural boundary.
The NIC approach integrates volume footprint reading within a structured framework: market structure first, then auction context, then order flow confirmation. Each layer narrows the field of valid trades. By the time you are reading footprint data, you are not looking at a random price level, you are looking at the precise location the market has identified as significant.
That sequence is what separates analytical reading from random reaction.
Every mistake above shares a single root cause: the trader is reacting to data rather than reading the market.
Data reacting means: delta spiked, so I buy. Volume appeared, so I confirm. An imbalance printed, so I enter.
Market reading means: where is this data printing? What is the structure behind it? What does the auction history say about this location? What does this volume tell me about who is trapped and what they will have to do next?
The difference between these two approaches is the difference between an indicator mindset and an order flow mindset. And it is why the NIC framework begins, always with structure before execution, and with questions before conclusions.
Price and volume are the only two inputs that matter. Every indicator in existence is derived from one or both of them. The trader who learns to read price and volume directly, without derivation, without the lag of secondary calculations — is reading the market the way institutions do.
That is the edge. Not a tool. Not a signal. A way of reading.
Understanding these mistakes is the first step. The second step is developing the ability to read what the market is actually doing, session by session, level by level, candle by candle.
That is exactly what I teach inside NIC, No Indicator Concepts. The curriculum is built around one conviction: the market speaks through price and volume, and a trained eye does not need anything else.
If this way of reading markets resonates with you, the next step is to see it in real time.
Every Sunday at 9 PM, I host a private Google Meet session where I walk through live market structure, order flow, and the NIC framework in real conditions. No recording. No replay. Just the market, the chart, and the kind of analytical thinking that takes years to develop, accelerated into a single session.
Details are on WhatsApp. Reach out directly.
Kumar Ravishanker Singh — professionally known as Kumar Singh — is the founder of Kumar Singh Global Trading Academy (OPC) Private Limited (KSGTA). The views expressed in this article are educational in nature and do not constitute financial advice, investment recommendations, or trading tips of any kind. KSGTA is not registered with SEBI or any financial regulatory authority worldwide. Trading involves substantial risk. Past performance is not indicative of future results.
The most common mistake is treating every volume spike or delta shift as a trade signal. Order flow data is only meaningful in structural context, at significant price levels, after understanding the auction history of that area. Without that context, high-volume readings produce as many losing trades as winning ones.
NIC No Indicator Concepts is a framework that reads market structure through price and volume alone, without any derived indicators. Standard order flow courses teach tools: how to read a footprint chart, what delta means. NIC teaches a method: how to sequence structural analysis, auction context, and volume reading into a disciplined process. The difference is between learning a tool and developing a way of thinking.
Order flow is a function of the auction process, which occurs in every liquid, exchange-traded market, equities, futures, forex majors, indices. The principles of volume acceptance, absorption, and unfinished auctions are universal. Timeframe application depends on what you are trying to read: structural context requires higher timeframes; execution-level reading uses lower ones.
All indicators are derived from price and volume they are mathematical transformations of the two inputs the market actually produces. That derivation introduces lag and removes context. When you read price and volume directly, you are reading the market's primary output without translation. Order flow analysis succeeds where indicators fail because it is closer to the source of the information.
The conceptual framework can be understood quickly. Reading it correctly under live market conditions with discipline, without reactive decision-making, takes structured practice over months, not days. The reason most traders fail at order flow is not intelligence. It is the absence of a structured learning sequence. NIC Pro is built around a 20-module curriculum specifically designed to develop this ability systematically, not randomly.