We Teach Trading — Zero Tips, Zero Advice, Zero Recommendations. Not registered with SEBI or any financial regulator worldwide.
We Teach Trading — Zero Tips, Zero Advice, Zero Recommendations. Not registered with SEBI or any financial regulator worldwide.
A practical guide by Kumar Singh for Indian and global traders. What order flow really shows, how footprint charts work on Nifty, gold and crypto, what TradingView can and cannot do, and how the NIC Pro™ Institutional Order Flow and Volume Footprint Mentorship teaches it live.
Order flow trading is the practice of reading executed transactions at every price, who bought at the ask and who sold at the bid, to understand which side of the market is aggressive and where large participants are active. Traders read it through footprint charts, delta, volume profile and time and sales instead of lagging indicators.
That is the textbook answer. Here is mine, after reading markets independently since 1994: price tells you where the market went. Order flow tells you who pushed it there, how hard they pushed, and whether anyone was waiting on the other side.
Order flow is raw transaction data. It is not an indicator and it does not use a formula.
A footprint chart splits each candle into price rows and shows bid volume, ask volume and delta at each row.
Market orders are aggressive and move price. Limit orders are passive and absorb it. Order flow shows the fight between the two.
You cannot see who a participant is. You can see how size behaves at a price, and that is what matters.
Order flow needs centralized exchange volume. Index futures, stock futures, commodity futures and crypto exchange data work. Spot forex and spot indices do not.
No single footprint signal is a trade. Context and location decide what a signal means.
Order flow is a skill learned live, on real tape, with feedback. Recorded videos alone rarely get a trader there.
Every trade on an exchange has two sides. One side was already sitting in the order book with a limit order. The other side arrived with a market order and took that liquidity. Order flow is the record of those matches: the price, the size, and which side was the aggressor.
Aggressive buyer: sends a market buy, trades at the ask, lifts the offer.
Aggressive seller: sends a market sell, trades at the bid, hits the bid.
Passive participant: rests a limit order and waits to be filled.
When aggressive buyers consistently outnumber passive sellers, price rises. When passive sellers absorb everything buyers throw at them, price stalls. That is the whole game, seen one print at a time.
Price action reads the outcome: open, high, low, close, and the structure they build.
Order flow reads the process inside the candle: how much volume traded at each price, and who initiated it.
Two candles can look identical on a chart and have completely opposite order flow underneath. One closed up because buyers were strong. The other closed up because sellers simply stopped selling. Those are different markets.
I read structure first and order flow second. Structure tells me where to look. Order flow tells me what is happening when price gets there.
No. And this matters to me more than most, because I built my whole teaching on a zero-indicator philosophy: Pure Structure. Real Markets. Zero Indicators.
An indicator takes price data and runs a formula on it. RSI, MACD and moving averages are calculated outputs.
A footprint chart runs no formula. It displays traded volume, split by aggressor, at each price. It is the data itself, organized.
Delta is simple arithmetic (ask volume minus bid volume). It is a count, not a prediction.
The same is true for volume profile and VWAP. They represent where real participation happened. They are records, not forecasts.
So when someone searches for an "order flow indicator," what they usually need is an order flow chart and the skill to read it.
Large participants cannot fill big orders in one click without moving price against themselves.
So they work orders over time: splitting size, resting large limit orders, refilling them as they get hit (often called iceberg behavior.
That behavior leaves traces. Heavy volume at one price with no price progress. Repeated refills at the same level. Aggression that suddenly dries up at an extreme.
You never see a name on the tape. You see the behavior of size. Reading that behavior is what I mean by institutional order flow.
These are the building blocks. Every serious order flow trader, in Mumbai, London or Chicago, uses the same vocabulary.
Bid volume: contracts traded at the bid. These were aggressive sellers.
Ask volume: contracts traded at the ask. These were aggressive buyers.
Delta: ask volume minus bid volume, per row or per candle. Positive delta means buyers were more aggressive. Negative means sellers were.
Cumulative delta: a running total of delta across candles. Useful for spotting when price and aggression stop agreeing.
Point of Control (POC): the price with the highest traded volume in a candle, session or range. The market's most accepted price for that period.
Value area: the price range containing roughly 70% of volume. Price outside value is being tested for acceptance or rejection.
Diagonal imbalance: ask volume at one price compared with bid volume one row below (or bid vs ask one row above, for selling). A ratio of 3:1 or more is a common threshold. Diagonal, because buyers lift the offer while the bid sits one tick lower.
Stacked imbalance: two or more imbalances in consecutive rows. Shows urgency from one side.
Absorption: heavy aggressive volume at a price, but price fails to move further. Passive orders are soaking it up.
Exhaustion: aggressive volume dries up at an extreme. The push runs out of participants.
Time and sales (the tape): the raw list of every print with time, price and size.
Depth of Market (DOM): resting limit orders waiting in the book. Useful, but treat it with care. Resting orders can be pulled before price reaches them. Executed volume is harder to fake.
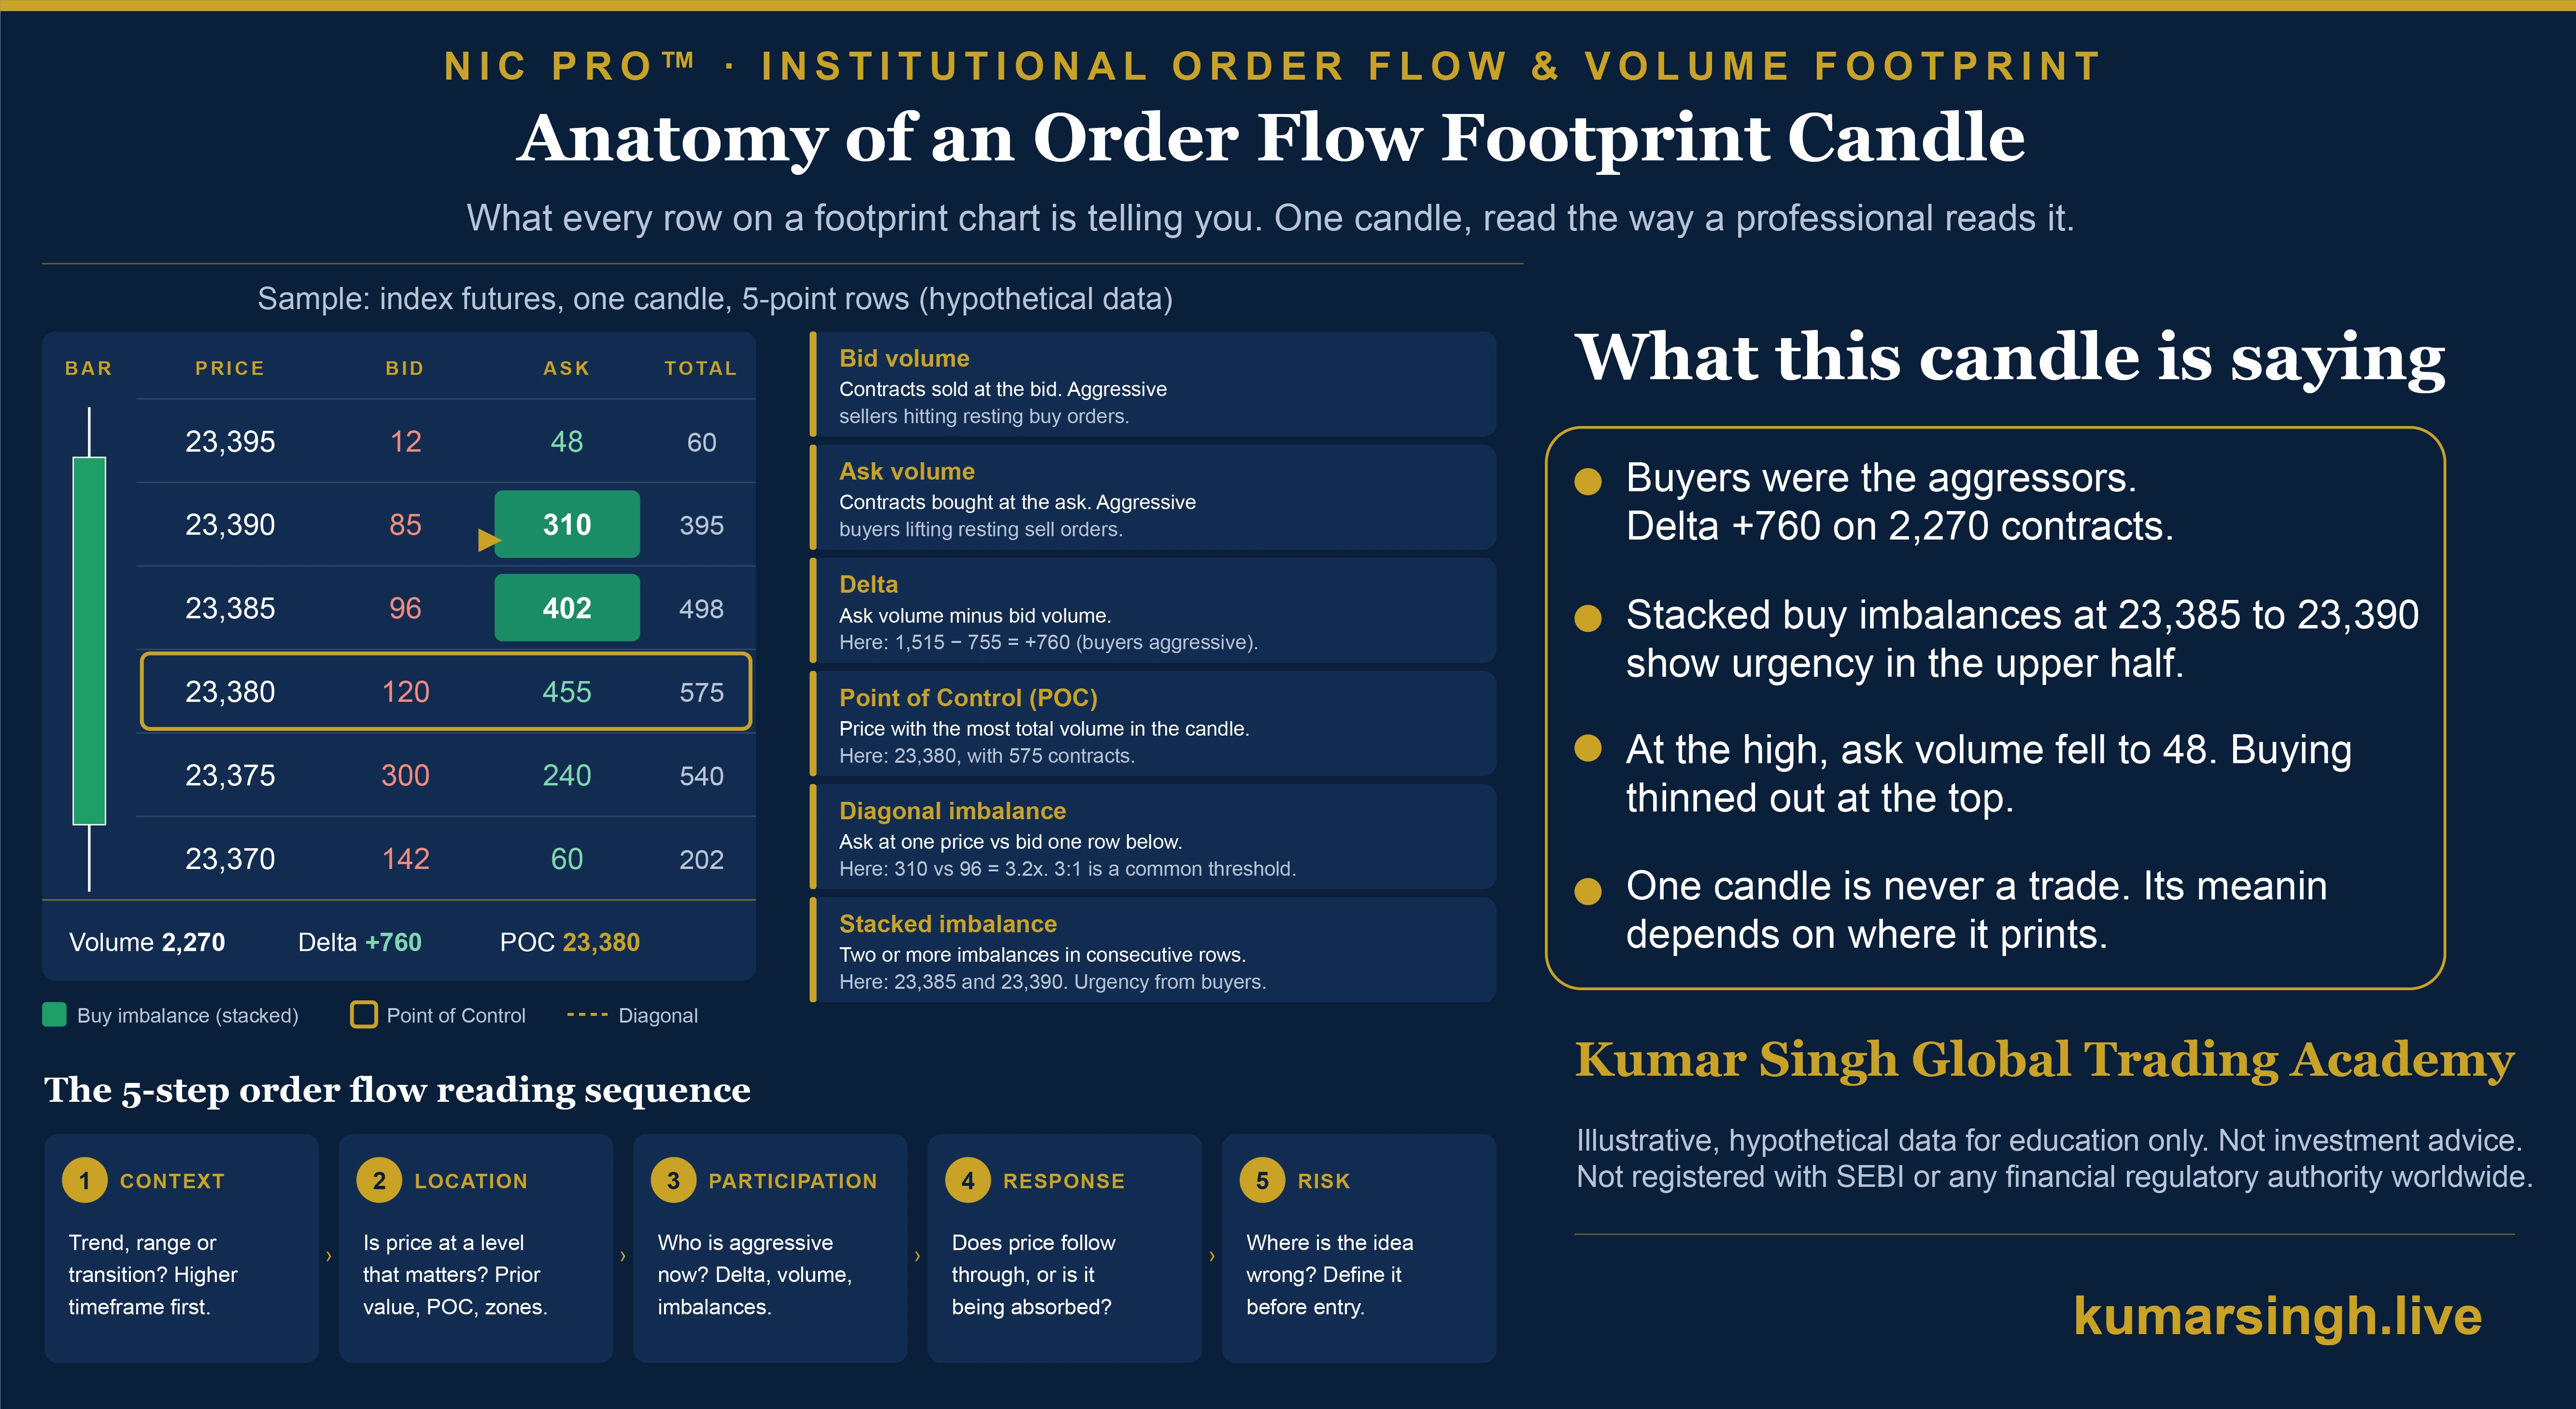
Use the infographic above. It is a single hypothetical index futures candle split into 5-point rows.
Read the totals first. 2,270 contracts traded. Ask volume 1,515, bid volume 755. Delta +760. Buyers were the aggressors.
Find the POC. 23,380 traded 575 contracts, more than any other row. That is where the most business happened inside this candle.
Check the diagonals. At 23,390, buyers lifted 310 contracts at the ask while only 96 sold at the bid one row below. That is 3.2 to 1. At 23,385, 402 against 120. That is 3.35 to 1. Two buy imbalances in a row. Stacked.
Look at the extremes. At the high, 23,395, only 48 contracts traded at the ask. The buying that drove the candle thinned out right at the top.
Now ask the only question that matters: where did this candle print? At a prior value area low after a decline, this reads very differently than at a fresh high after five green candles into a known supply zone.
That last step is where most self-taught order flow traders go wrong. They read the footprint perfectly and ignore the map.
Search "order flow trading strategy" and you will find a hundred setups. Most are single signals pulled out of context. A professional framework is a sequence, and it looks something like this.
Context: Is the market trending, ranging or transitioning? Read higher timeframe structure first.
Location: Is price at a level that matters? Prior value, a POC, a range edge, a zone where the market previously reacted with force.
Participation: Who is aggressive right now? Delta, imbalances, volume at price.
Response: Does price follow through on that aggression, or is it being absorbed?
Risk: Where is the idea proven wrong? Define it before you enter, never after.
It will not predict the future. It shows you what is happening now, with more resolution than a candle.
It will not turn a single imbalance or a delta divergence into a trade. These are clues, not triggers.
It will not replace risk management. Order flow traders blow up accounts too, usually by being right about the read and wrong about the size.
It will not work the same on every instrument. Liquidity, tick size and participant mix change how footprints behave.
Inside NIC Pro, the full execution rules, including the conditions of my Institutional Order Flow and Volume Footprint 1-2-3 Formula, are taught live in mentorship only. They are never published. What I share publicly is the concept. What I teach live is the application.
Two of the most common searches are "order flow indicator TradingView" and "order flow TradingView." Here is an honest answer.
TradingView offers a native volume footprint chart type on selected paid plans. Check current plan details, as these change.
The quality of any footprint depends on the data behind it. The platform needs tick-level trade data with aggressor information for that symbol. Where aggressor side is not supplied, platforms infer it by comparing each trade price with the prevailing bid and ask.
Community scripts that estimate buying and selling volume from OHLC candles are approximations. They guess the split. They do not read real transactions. Treat them as rough sketches, not order flow.
For Indian futures, confirm what your broker or data vendor actually supplies before you trust a footprint on any platform.
For forex, remember that spot currency is traded over the counter. There is no single, central volume record. For real exchange volume, traders use currency futures, such as CME euro futures for EUR/USD.
My rule for students is simple. First confirm the data is real. Then learn to read it. The platform is secondary.
COMEX gold futures (GC): centralized exchange volume. This is where most global gold order flow reading is done.
XAUUSD spot: traded over the counter. Volume you see on a spot chart is usually your broker's tick activity, not the whole market. A footprint on spot gold reflects one feed, not global participation.
MCX gold futures: India's exchange-traded gold, priced in rupees. Real exchange volume, but prices also carry the effect of USD/INR moves and Indian import costs, so MCX can diverge from international gold intraday.
Gold order flow is event-driven. US data, central bank decisions and geopolitical headlines produce sudden aggression. Imbalances form fast and spreads widen.
Liquidity shifts through the day, and the London and New York sessions typically see the heaviest activity.
Reading gold live around news is one of the best ways to see absorption and exhaustion in their purest form, and one of the fastest ways to lose money if you have not practiced it.
Stock futures of liquid F&O names give usable footprints. Thin contracts give noisy ones.
Options are a different animal. Volume is scattered across many strikes and expiries, and hedging flows distort the picture. Many order flow traders read the future and use options only as the execution vehicle.
MCX commodities such as crude oil, gold and silver futures have centralized volume and can be read the same way.
Session rhythm matters. The opening hour, lunch-time lull, closing hour and expiry days each produce distinct footprint behavior.
Live, you see absorption build print by print, not as a finished number.
Live, you see liquidity pulled from the book seconds before price arrives.
Live, you learn to sit on your hands when the read is unclear. No video teaches patience.
Live, a mentor can stop you mid-session and ask: what are you seeing, and why?
This is why NIC Pro is taught as live mentorship. Recorded material supports the learning. It does not replace the screen.
Market microstructure: order types, the bid-ask spread, aggressor side, order book mechanics.
Footprint reading: delta, imbalances, POC, absorption, exhaustion.
Volume profile and VWAP: where participation actually happened across sessions and ranges.
Data: which instruments have real volume, which feeds to trust, and why.
Execution: entries, invalidation and exits within a defined framework.
Risk and psychology: position sizing, drawdown handling, and the discipline to skip trades.
Live application with feedback.
"Accuracy" claims for a secret indicator.
Buy and sell calls or tips sold as education.
No risk management module.
No live component, only recorded videos.
A mentor who cannot explain why a setup fails.
People search for order flow in Tamil, Hindi, Telugu and many other languages. Good. Order flow is not an English-only skill. I teach in English and in Hindi and Hinglish, depending on the batch. Global traders learn in English. The tape reads the same in every language.
I have been reading markets independently since 1994. I never learned this from a trading course. I learned it from charts and tape, one session at a time.
I built my method on a zero-indicator philosophy. Structure, volume and order flow. Nothing calculated on top of them.
I am the founder of Kumar Singh Global Trading Academy (OPC) Private Limited, where I teach my NIC™ (No Indicator Concepts) frameworks to traders in India and abroad.
I personally reply to comments, questions and calls. That is a choice, not a marketing line.
NIC Pro is the flagship mentorship of Kumar Singh Global Trading Academy. It teaches traders to read markets through structure, volume and order flow, with zero indicators.
NIC Pro 1:1 private mentorship for traders who want individual attention and a pace built around them.
NIC Pro Group mentorship for traders who learn well alongside peers.
NIC Fundamentals for traders starting the NIC way of reading markets.
NIC Anchor Flow, a self-paced course on VWAP and anchored VWAP, positioned as a foundation and on-ramp to live mentorship.
Proprietary frameworks including the Institutional Order Flow and Volume Footprint 1-2-3 Formula, Periodic Volume Profile Research, the Institutional FVG Framework, Mother Candle Logic and L1-L3 Candle Body and Wick Psychology.
Advanced Execution Models (Phase 5): PRM (Volume Footprint Peak Row Method), RZF Break (Rejection Zone Flip Break), the FRVP Range Execution Model and ABR (Anchor Body Reclaim).
Confidential member method books for specific frameworks, issued only to NIC Pro members.
Lifetime Mentorship Support, an optional add-on available at enrolment only.
Footprint, FVG and Periodic Volume Profile, Fixed Range Volume Profile, Volume Profile Market Structure, and all Advanced Execution Model modules are exclusive to NIC Pro and are not sold separately.
Because indicators hide the market. I want traders to read the auction directly.
Because order flow is a live skill. So the core of NIC Pro is live mentorship, not a video library.
Because method matters more than setups. Students learn why a read works and when it fails, not a list of patterns to copy.
Because proprietary work deserves protection. Exact entry and exit conditions are taught verbally in live sessions only, never in public content.
Because education is not advice. We teach how to read markets. We do not give buy or sell calls.
It's life changing. Period.
Before joining Kumar Sir's mentorship, I had already tried multiple programs. I had spent serious money, time and energy looking for the right guidance. What I got was thin material, almost no follow-up, and hardly any personal interaction with the mentor.
So, when I came across Kumar Sir's mentorship, I was skeptical.
What happened after joining completely changed my idea of what a mentor should be.
Kumar Sir gives you something money alone cannot buy. His time, his attention, his patience. He is always there to answer questions, clear doubts, correct mistakes, and explain again until the concept actually sinks in.
He doesn't teach and disappear.
He stays with you.
He pushes you.
He corrects you.After completing the mentorship, I can say this from my heart. Kumar Sir is not running a mentorship program in the usual sense. He is on a mission to change the way people think.
There is a beautiful saying. "When the student is ready, the teacher appears." For me, that teacher was Kumar Sir.
I feel fortunate our paths crossed at the right time. I am loving every minute of this journey, because I am not learning a strategy or a system. I am learning how to see the market differently, think differently, and operate with far more clarity and confidence.
Some people look at the fee and feel it is expensive. I felt the same in the beginning.
Today I feel the opposite. The depth of knowledge, the personal attention, the support and the genuine involvement are worth far more to me than what I paid. I am speaking about the education itself, not about any trading outcome.
Kumar Sir, thank you for your patience, for your generosity with your knowledge, and for genuinely caring about your students.
Some people teach.
Some people mentor.
And a rare few change the direction of your journey.For me, Kumar Sir is one of those rare people.
Rajesh Kumar
Singapore | NIC Pro Mentorship
Dear Sir,
I am sincerely thankful to you, because you have given me new hope in my trading life. For the last 5 years I was comfortable with option selling, but in option buying it was just the opposite. I attended 3 mentorship programs before this but could never connect with the way it was taught.Then one day a friend forwarded me Kumar Sir's YouTube link, and the same day I joined Kumar Singh Global Trading Academy. Since then, I have not looked back. The concepts were explained in such a way that I finally understood how to read volume and buying and selling pressure. Meaning, I can now read the price behavior of the market instead of guessing.
The teaching style of Kumar Sir is very simple and easy to understand. If anyone is looking at the market seriously, they must join Kumar Sir's mentorship.
Today my approach to option buying has changed. I know why I am entering and why I am exiting. That is the beauty of Kumar Sir's concepts (Order Flow and Volume Footprint).
Lalan Chowdhary
Full-Time Option Buyer | Order Flow & Volume Footprint
Delhi, India
Individual student experiences. Not indicative of trading results. Education only, not investment advice.
Anywhere there is centralized volume, the reading works: NSE and MCX futures, CME futures, COMEX gold, and crypto exchange data.
Sessions run online, so a trader in Dubai, London, Singapore or Toronto learns the same material as a trader in Delhi or Patna.
Direct access to the mentor. Traders learn from me, not from a rotating panel of assistants.
No indicator dependency. Nothing to repaint, no settings to tune. The skill travels with you across platforms and markets.
Honest framing. Clear disclaimers, no profit promises, no signal selling.
Praise is easy to write about your own work. So here is a fair view, strengths and limits together.
A deep, structured curriculum that goes from market structure to footprint execution, not scattered tips.
Genuinely original frameworks, built from decades of independent market reading, with confidential method books to support them.
Live mentorship with the founder, and a founder who actually answers questions.
A consistent philosophy. Zero indicators is not a slogan here. It is how every module is built.
Traders looking for tips, signals or copy trading.
Anyone expecting guaranteed income. Nobody can honestly promise that.
Traders unwilling to put in screen time. Order flow rewards hours of observation.
Anyone who wants regulated investment advice. This is education.
This article is for educational purposes only. It is not investment advice, a recommendation, or a solicitation to buy or sell any security, derivative, commodity or cryptocurrency. All examples, including the footprint candle in the infographic, use hypothetical data for illustration. Trading in futures, options, commodities and crypto involves substantial risk of loss and is not suitable for everyone. Past observations do not guarantee future results. Kumar Singh Global Trading Academy (OPC) Private Limited and Kumar Singh are not registered with SEBI or any financial regulatory authority worldwide. Consult a registered financial adviser before making any investment decision.
NIC™, NIC Pro™ and related marks are trademarks of Kumar Singh Global Trading Academy (OPC) Private Limited.
New to order flow, or ready to learn it properly? These are the questions traders ask most, answered clearly and honestly.
Order flow is a way of reading markets, not a guarantee of profit. It gives more information than a price chart alone. Results depend on the trader's framework, risk management and discipline.