We Teach Trading — Zero Tips, Zero Advice, Zero Recommendations. Not registered with SEBI or any financial regulator worldwide.
We Teach Trading — Zero Tips, Zero Advice, Zero Recommendations. Not registered with SEBI or any financial regulator worldwide.
Most people meet order flow through screenshots and big claims. This is the honest version. What order flow trading actually means on NSE and BSE, where the data helps you, where it lets you down, and why it is a skill and not a shortcut.
Most traders meet order flow the wrong way. A screenshot. A green arrow. A caption that says the big money got in here. It looks like a secret. It is not a secret.
Order flow is just reading who is actually buying and selling, and how hard. Not a line that lags three candles behind price. The real thing. Buyers lifting offers. Sellers hitting bids. Volume stacking at a level and then drying up. That is the market talking. Everything else is commentary.
This article is the honest version. What order flow trading means on the NSE and the BSE, where it genuinely helps you, and where it will frustrate you if nobody tells you the truth first.
Price tells you where the market went. Order flow tells you how it got there.
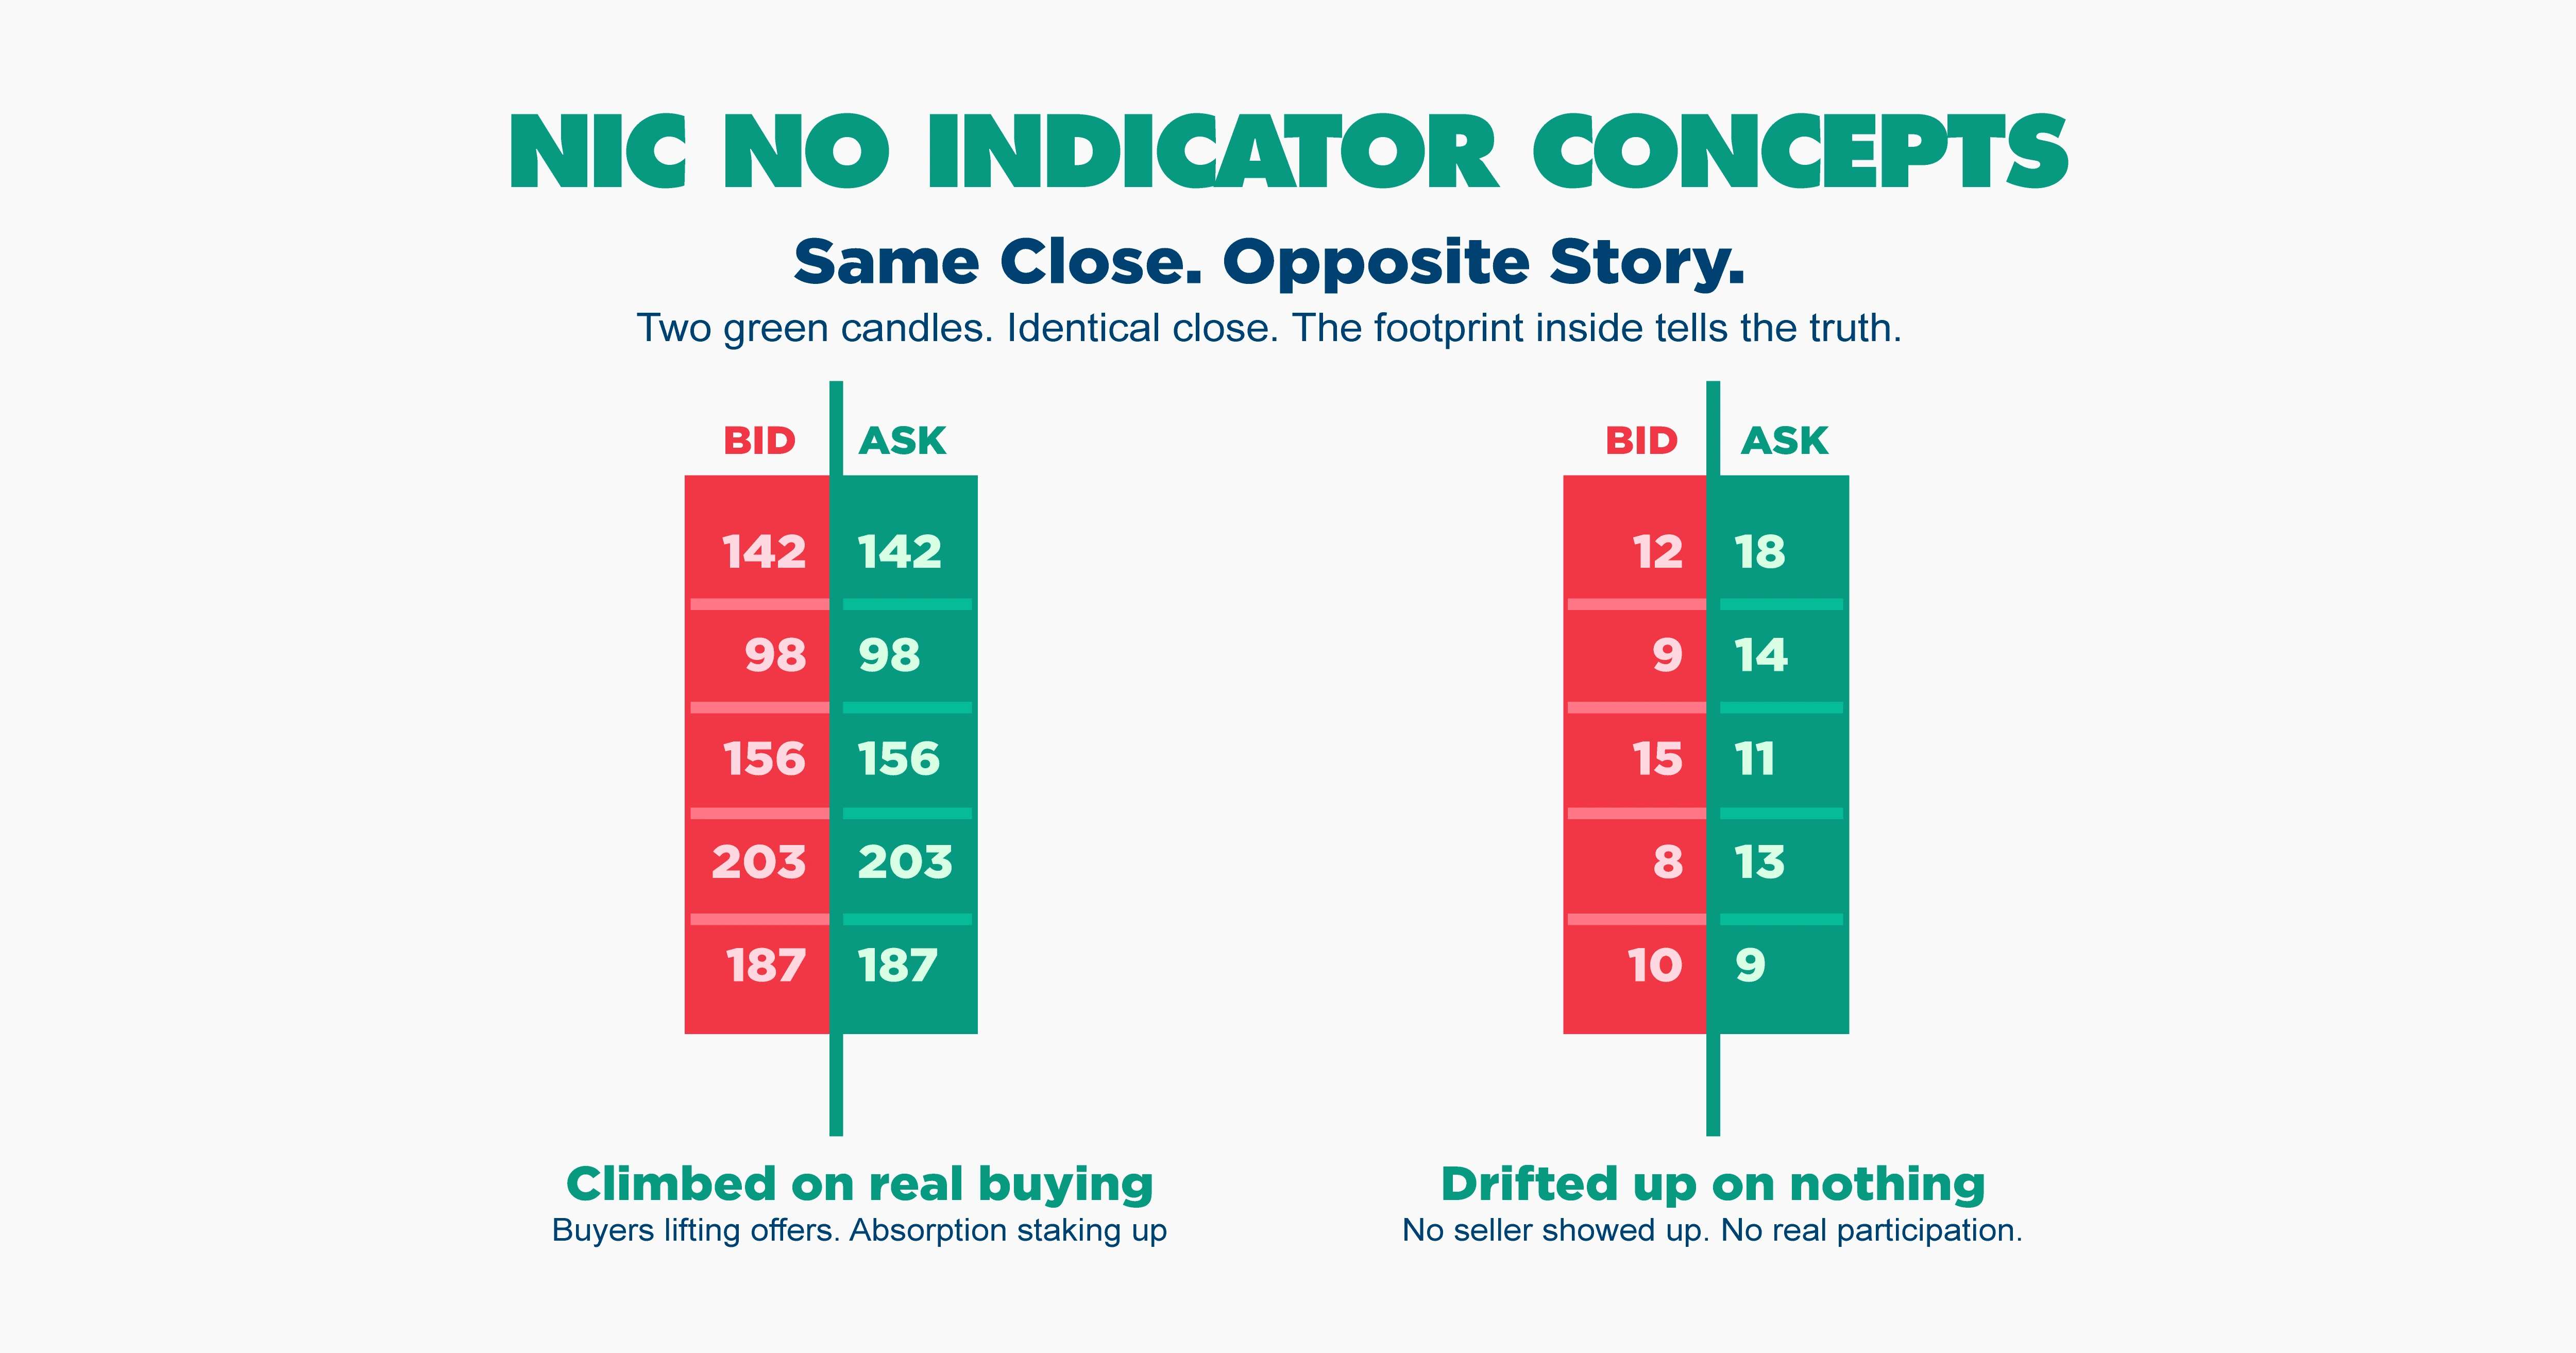
Two candles can close at the same level and mean opposite things. One climbed on heavy buying that kept getting absorbed. The other drifted up on nothing because no seller showed up. Same close. Different story. An indicator reads both as the same green candle. Order flow does not.
You read it through the things that record real activity. Volume at each price. The footprint inside a candle showing buys versus sells. Cumulative volume delta tracking the net pressure over time. Where the volume profile builds a fat node and where it leaves a thin one. None of this is predicting the future. It is reading the present clearly. That distinction matters.
People say "Indian markets" like it is one thing. For order flow it is not.
The NSE carries the bulk of the liquidity, especially in derivatives. Nifty, Bank Nifty, Fin Nifty, the index options, the liquid stock futures. That is where real participation shows up tick by tick, which is exactly what order flow needs to work. Heavy, continuous, two-sided activity. When a market is liquid, the footprint means something. You can see absorption. You can see imbalance. You can see a level get defended.
The BSE runs lighter on most names. Plenty of stocks there trade thin. And thin is the enemy of order flow. When only a handful of orders cross in a minute, the data is noise, not signal. A single large order can paint a picture that means nothing. You read absorption that was just one participant. So the honest rule is simple. Order flow rewards liquid instruments and punishes illiquid ones. On NSE that means the index complex and the large, active names. On BSE it means being far more selective about what you even look at.
This is not an opinion about which exchange is better. It is about where the data is dense enough to read.
Here is the part the screenshot crowd skips.
Order flow needs good data. Footprint charts need tick-by-tick trade data, not minute candles. A clean volume profile needs every print, not a summary. And in India, retail access to deep, accurate market data has historically been thinner than what traders abroad take for granted. Level 2 depth, true tick feeds, reliable footprint data. It exists, but you have to know what you are paying for and whether your broker and platform actually deliver it.
If your data is delayed, aggregated, or incomplete, your footprint lies to you. And a lying footprint is worse than no footprint, because it gives you false confidence. So before anyone learns a single setup, they need to understand what their data is and is not telling them. That is unglamorous. It is also the difference between reading the market and reading a fiction.
It does not predict. It does not guarantee. It does not turn a level into a sure thing.
A clean order flow read tells you what is happening right now and what the immediate intent looks like. It improves the quality of your decision. It does not remove risk, and anyone selling it as a way to stop losing is selling you a story. Markets stay uncertain. Large participants change their minds. Liquidity vanishes when you least expect it. Order flow gives you a sharper lens. It does not give you certainty, and no honest teacher will tell you otherwise.
If that sounds less exciting than the screenshots, good. The screenshots were the problem.
The standard toolkit, RSI, MACD, moving averages, all of it is built on past price. It smooths and lags by design. By the time the signal prints, the move it was reacting to already happened. You end up trading an echo.
Order flow skips the echo. It reads the activity that creates the move while it is forming. That is the entire reason the NIC methodology builds on pure structure, order flow, and volume footprint instead of lagging signals. Not because indicators are evil. Because there is a more direct way to see what the market is doing, and once you have seen it, the indicator feels like watching the road through the rearview mirror.
Honestly? Time and reps. Reading order flow is a skill, closer to learning to read a language than installing a tool. The footprint looks like chaos at first. Then patterns start to surface. Absorption at a level. Imbalance running one way. Volume building and stalling. You do not memories these. You learn to see them, and seeing takes screen time.
There is no setup that works because you copied it. There is only a way of reading that you build, slowly, until the chart stops looking like noise. That is the work. Anyone who tells you it is faster than that has something to sell you.
Start with the liquid stuff. The NSE index complex and the most active names, where the data is dense and honest. Confirm your data feed actually gives you tick-level information before you trust a single footprint. Learn to read what is there before you try to act on it. And treat every read as information that sharpens a decision, never as a promise about the next candle.
That is order flow trading on NSE and BSE without the marketing layer. A clearer way to read the market, real work to learn it, and no shortcuts hiding in the screenshots.
Kumar Singh Global Trading Academy teaches the NIC methodology, a pure structure, institutional order flow, and volume footprint approach to reading financial markets. Trading in financial markets involves substantial risk. The content above is educational and concerns skills and concepts in market reading. It is not investment advice and makes no representation about financial outcomes.
Order flow trading is reading who is actually buying and selling, and how aggressively, instead of relying on lagging indicators. Price tells you where the market went. Order flow tells you how it got there, through volume at each level, the footprint inside a candle, and the net pressure over time.
Yes, and the NSE is where it works best in India, because the index complex (Nifty, Bank Nifty, Fin Nifty) and liquid stock futures carry heavy, continuous, two-sided activity. Order flow rewards liquid instruments, and that's exactly where NSE participation is densest. Thin, illiquid names are where the data turns to noise.
For most traders, NSE. It holds the bulk of derivatives liquidity, so the footprint actually means something. The BSE runs lighter on many names, and thin markets produce footprint reads that mislead more than they help. It's not about which exchange is better overall, it's about where the data is dense enough to read.
You need tick-by-tick trade data, not minute candles, plus market depth and a reliable footprint feed. The honest catch is that deep, accurate retail data in India has historically been thinner than abroad, so confirm what your broker and platform actually deliver before you trust a single footprint. Bad data gives false confidence, which is worse than no data.
Indicators like RSI, MACD, and moving averages are built on past price, so they lag by design. By the time the signal prints, the move already happened. Order flow reads the activity while it forms, so you see the market directly instead of through the rearview mirror. That's the reasoning, not a claim that one guarantees results.
A footprint chart shows the buying and selling that happened inside each candle, usually displayed as bid versus ask volume at every price level. Two candles can close identically yet have completely different footprints, one built on real buying, one on nothing. The footprint is what reveals that difference.
Yes, but treat it as a skill you build with screen time, closer to learning to read a language than installing a tool. The footprint looks like chaos at first, then patterns like absorption and imbalance start to surface. There's no setup that works just because you copied it, so anyone promising a fast shortcut is selling a story.
Yes. Order flow is a method of market analysis, reading publicly available trade and volume data. It's an educational and analytical approach, not anything restricted.
Volume profile shows where volume built up across price over a session, highlighting heavy and thin zones. Order flow is broader, the live reading of buy and sell pressure as it happens, with volume profile being one tool inside it alongside footprint and cumulative delta.