We Teach Trading — Zero Tips, Zero Advice, Zero Recommendations. Not registered with SEBI or any financial regulator worldwide.
We Teach Trading — Zero Tips, Zero Advice, Zero Recommendations. Not registered with SEBI or any financial regulator worldwide.
Serious traders ask what software they need for order flow. Bloomberg, NinjaTrader, Sierra Chart. The honest answer costs less than most expect.
The first question I get from serious traders thinking about order flow is almost always the same. What software do I need.
It is a fair question. The answer is usually different from what they expect.
A trader writes to me from Sydney, Lagos, London, or Mumbai. They have been told they need Bloomberg. Or NinjaTrader. Or Sierra Chart. Or some combination of subscriptions running them three to five hundred US dollars a month before they have placed a single trade. They are about to commit serious capital to a setup they barely understand.
That is the moment to slow down.
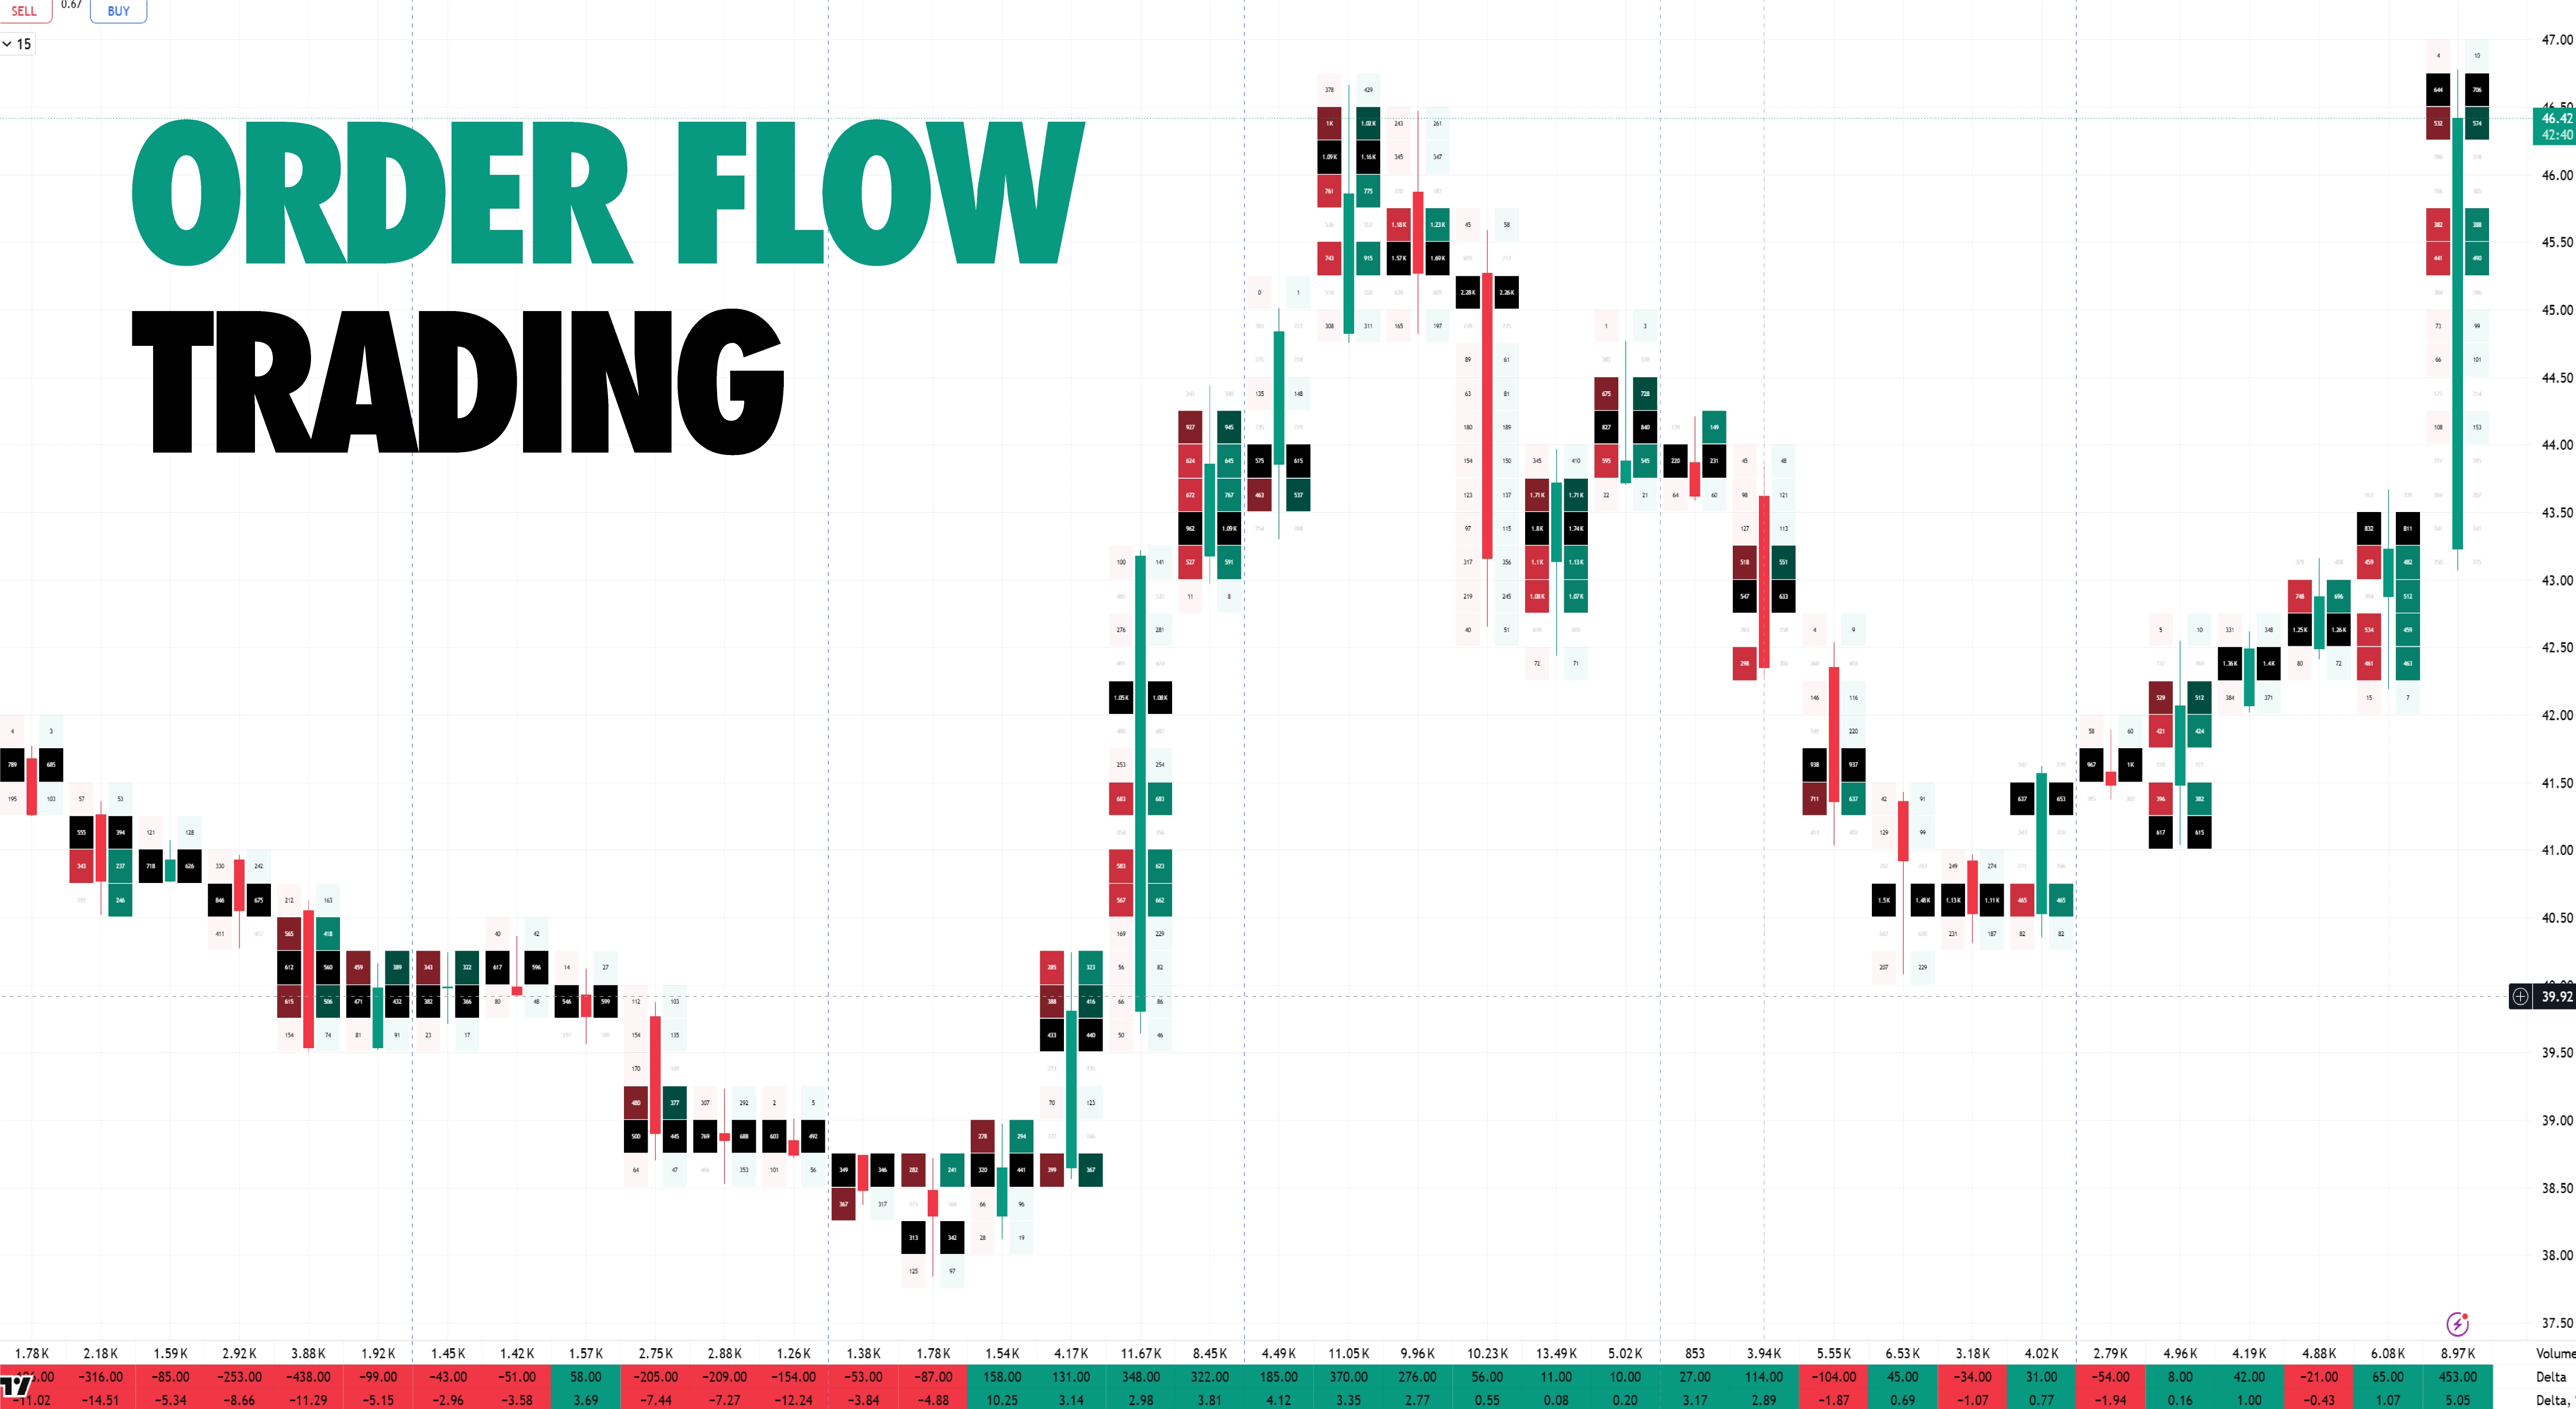
Order flow is the record of real executed trades. Aggressors hitting bids. Aggressors lifting offers. Absorption at key levels. The footprint of large money entering or exiting a position in the present tense.
It is the opposite of an indicator.
An indicator like RSI or MACD is a calculation done on past prices, smoothed and delayed by definition. Order flow is the raw print of what just happened. Bid-ask imbalance. Cumulative volume delta. Volume at price. Footprint clusters.
When institutions move size, they leave a trail in this data. The retail trader staring at MACD never sees the trail. The trader reading order flow sees it as it forms.
This is the gap NIC was built to close. NIC stands for No Indicator Concepts. Pure structure. Real markets. Zero indicators.
Most retail traders are told order flow requires expensive professional software. Some of that is true at the institutional level. Most of it is not true for serious retail.
Here is the honest range of what is available.
Bloomberg Terminal sits at the top end. Around twenty four thousand US dollars per year. It is built for institutional desks. No serious retail trader needs it for order flow study.
NinjaTrader, Sierra Chart, Bookmap, ATAS, Quantower, MotiveWave, and Jigsaw sit in the professional retail bracket. Many of them are excellent. The catch is the stack underneath. To use them properly you need real-time exchange data feeds, which run anywhere from seventy five to two hundred US dollars per month per exchange. Add the platform fee and you are at three hundred plus US dollars per month before learning anything.
For a trader in India, the UAE, Australia, or anywhere outside the United States, the setup is heavier still. Many of these platforms require a Windows machine, technical configuration, and broker integrations that do not exist in every jurisdiction.
TradingView sits in a different category entirely. Fifteen to sixty US dollars per month depending on tier. Browser-based. Works on any operating system. Covers Indian equities, US stocks, crypto, forex, commodities, and indices in one window.
Volume profile is native. VWAP and anchored VWAP are native. Cumulative volume delta is available through community indicators. Footprint clusters were added to the platform on the higher tiers.
For most of what a retail trader needs to learn order flow as a reading skill, TradingView is enough.
A trader can spend five hundred US dollars a month on the most powerful platforms in the world and still not know what they are looking at.
A trader can spend fifteen US dollars a month on TradingView and read institutional behavior cleanly, with the right methodology behind their eyes.
This is the real lesson. The tool is not the bottleneck.
The bottleneck is the framework you use when you sit in front of the chart. Whether you can see structure or only candles. Whether you can read a footprint or only count bars. Whether you understand why CPR levels matter as institutional reference zones or you keep treating them as another indicator.
The same TradingView terminal in the hands of two different traders produces two completely different outcomes. One traces the institution. The other guesses with the crowd.
At Kumar Singh Global Trading Academy, the NIC framework is built specifically for this. Twenty modules across five learning phases. Institutional order flow. Volume footprint. Fair value gaps read the way institutions actually create and defend them. Periodic volume profile read across composite timeframes. The proprietary 1-2-3 Formula across order flow and volume footprint. Mother Candle Logic. Engulf Cycle Strategy. Parallel Channel Forecasting.
Every framework was developed independently through years of live market research. Every concept is taught privately or in small cohorts by Kumar Singh personally. No junior coaches. No outsourced support.
The methodology is taught entirely on TradingView for retail accessibility. For students who already use NinjaTrader, Sierra Chart, or ATAS, the concepts translate directly. The tool changes. The reading stays the same.
Kumar Singh Global Trading Academy (OPC) Private Limited is not registered as a SEBI Investment Adviser or Research Analyst. Nothing in this article constitutes investment advice, trading recommendations, or assured-return claims. Trading involves substantial risk. Past performance never indicates future results. Readers should consult a SEBI-registered or equivalent regulated professional in their jurisdiction before making any trading decision.
Start with the YouTube channel at youtube.com/@KumarSingh. Watch the long lessons. Sit in on a free Sunday Q&A session. Read for yourself.
When the methodology resonates, the mentorship is open. NIC Fundamentals for traders beginning the no-indicator journey. NIC Pro Group and NIC Pro 1-on-1 for traders ready for the complete institutional toolkit.
You do not need a Bloomberg Terminal. You need the right reading.
Educational purpose only. Not investment advice. Trading involves substantial risk.