We Teach Trading — Zero Tips, Zero Advice, Zero Recommendations. Not registered with SEBI or any financial regulator worldwide.
We Teach Trading — Zero Tips, Zero Advice, Zero Recommendations. Not registered with SEBI or any financial regulator worldwide.
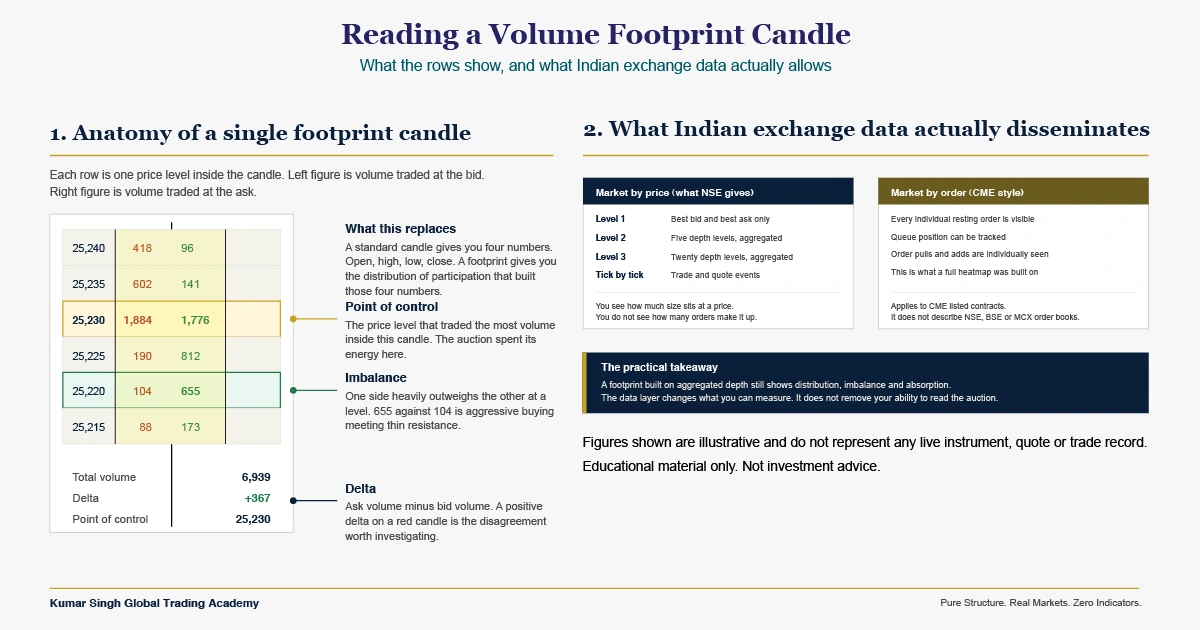
CME feeds and heatmap software are being presented as entry requirements for order flow trading on Indian exchanges. The data structure says otherwise. Here is the technically correct picture for traders in India and worldwide, covering what order flow really is, what a footprint chart can and cannot show, which platforms genuinely work on NSE, BSE and MCX, and how to learn the method properly.
Order flow trading has become a trend in India over the last six months. With the trend came a claim, repeated across Instagram, YouTube and Facebook by people presenting themselves as order flow traders. The claim is that to trade order flow or read a volume footprint on Indian markets, you must buy CME data, or you must run a full order book heatmap platform.
That claim does not survive contact with how exchange data actually works.
I want to be careful about what I am criticising here. I am not questioning anyone personally, and I am not naming anyone. I am correcting a technical claim that is being repeated widely, is factually wrong, and is causing new traders to spend money on data feeds that have no connection to the instrument they are trading. That is worth correcting on the record.
A trader who buys a CME subscription to trade Nifty has been sold a feed for a market they are not trading. The instrument is not on that exchange. The order book is not on that exchange. Nothing in that data describes the auction they are participating in.
Before the platform argument, the definition needs to be clean, because most of the confusion starts here.
Order flow is the study of executed transactions and resting orders, not the study of a derived line on a chart. You are reading who transacted, at what price, in what size, and against what resting interest.
It is not an indicator. An indicator takes price and volume that already happened and transforms it mathematically. Order flow reads the transaction record itself. Nothing is smoothed, averaged or lagged.
It answers a different question from price action. Price action tells you where the market went. Order flow tells you how hard it had to work to get there, and who was on the other side.
It is a context tool, not a signal generator. The same delta reading means opposite things at the top of a range and at the bottom of one. Without structural context, the numbers are noise with decimal places.
It exists across every liquid market. Equities, futures, options, commodities, currencies, crypto. The instrument changes. The auction logic does not.
A volume footprint takes a single candle and opens it up. Instead of four numbers, you get the distribution of participation that produced those four numbers.
Each row inside the candle is one price level, showing volume traded at the bid on one side and volume traded at the ask on the other.
Delta is the difference between the two. It tells you which side was the aggressor during that candle.
The point of control is the row that traded the most volume. That is where the auction spent its energy.
An imbalance is a row where one side heavily outweighs the other, which marks aggression meeting thin opposition.
Absorption is the opposite situation. Heavy aggression arrives and price does not move, which means resting orders are taking everything offered.
And here is the part rarely said out loud. A footprint does not show intent, and it does not show who the participant is. It shows the consequence of decisions already taken. Anyone telling you a footprint reveals what institutions are planning to do is describing something the data cannot contain.
CME Group data covers contracts listed on CME Group exchanges. That means instruments such as the S&P 500 futures complex, Nasdaq futures, crude oil, gold and the currency futures listed there.
Nifty, Bank Nifty, Reliance, and every NSE stock future and option are listed and matched on Indian exchanges. Their order books exist on those exchanges and nowhere else.
CME data therefore contains no information about the order flow of any Indian instrument. Not partial information. None.
There is a legitimate and much narrower use for US futures data, which is macro context. If crude is moving violently overnight, that matters for an Indian energy name the next morning. That is correlation and sentiment, not order flow.
Reading CME order flow to time a Bank Nifty entry is reading one market to trade another. If someone recommends this, the fair question is simple. Which contract, on which exchange, is generating the flow you are asking me to read.
There is one genuine exception worth knowing. GIFT Nifty trades at NSE International Exchange in GIFT City, and its dollar denominated contract does provide an offshore reference for Nifty. That is a real instrument with a real order book. It is also not CME data, and it is not a substitute for reading the domestic book.
This is the technical core, and it is the part almost nobody explains properly.
Market by price is what retail receives. The exchange publishes aggregated depth. You see that a given price level holds a certain quantity. You do not see how many separate orders make up that quantity.
The depth tiers are defined. Level 1 gives best bid and best ask. Level 2 gives five depth levels. Level 3 gives twenty depth levels. There is also a tick by tick feed carrying trade and quote events.
Market by order is a different thing entirely. In a market by order feed, every individual resting order is visible. You can track queue position, watch orders being pulled, and see the book rebuild order by order.
Order level data does exist in India, but it is distributed at the colocation and institutional tier. It is not what arrives through a retail broker API, and no retail platform can invent it.
This is why a heatmap looks different here. The signature value of a full order book heatmap comes from order by order visibility. Feed it aggregated depth and you get a thinner picture. Not a useless one. A thinner one.
The data layer changes what you can measure. It does not remove your ability to read the auction. Distribution, imbalance, absorption and point of control all survive aggregation, because they are computed from executed volume rather than from queue position.
I want to be accurate here rather than convenient, because inaccurate criticism is worse than no criticism.
Bookmap does work on Indian markets. It has operated through an Indian data vendor partnership for years, and there was an additional broker linked subscription offering NSE Level 2 depth for stocks, futures and options.
That broker linked route was later paused for new subscriptions while better full depth integration with Indian data providers was worked out. Historical data on that route was also limited, with only a short window available and only for a subset of large cap names.
So the correct statement is not that the platform fails in India. The correct statement is that the depth which makes a full heatmap powerful on CME style markets is not the depth Indian exchanges disseminate to retail.
The software is not the problem. Presenting it as a mandatory entry requirement is the problem. That is a marketing claim wearing a technical costume.
Here is the honest landscape, without affiliate motive.
GoCharting offers native footprint charting, volume profile and order flow metrics built around NSE and BSE segments, at a price point accessible to most retail traders.
Quantower is a capable multi asset platform used by Indian derivatives traders for footprint and volume analysis where a compatible data connection is available.
Definedge TradePoint is used widely for market profile and volume profile context on Indian instruments.
Broker depth ladders from Zerodha, Dhan, Fyers and Alice Blue give you basic tape and size monitoring. Useful for execution awareness. Not a substitute for a footprint.
TradingView provides a native volume footprint chart type, and for most traders learning this discipline it is the most practical place to start.
I recommend TradingView as a learning environment, and I am going to tell you exactly what it does and does not do, because you will find this out eventually and you should hear it first from your mentor.
A native volume footprint chart type available on Premium and higher plans, covering Indian equities, futures, options and commodities alongside global markets.
Full customisation of row sizing, imbalance thresholds and display, which matters more than most beginners realise.
Alert conditions on footprint events such as new and stacked imbalances.
One chart environment for every market you will ever study, so the skill transfers when you move between instruments.
Freedom to execute wherever you like. You learn to read on TradingView and you trade through Dhan, Fyers, Angel One or whichever broker you already use.
The buy and sell classification is derived from intrabar price direction, not from true aggressor matching against the bid and ask. It is a tick rule approximation.
Intrabar granularity depends on your plan and on how far back you scroll. Recent candles use the most granular data available. Deeper history is reconstructed from coarser intervals, so the footprints there are less precise.
This means delta on TradingView is an estimate, not an exact aggressor count.
Now the part that matters. Does that break the method? No, and here is why. Structural footprint reading depends on where volume concentrated, where one side overwhelmed the other, and where aggression arrived and failed to move price. Those patterns hold under a tick rule classification because they are driven by the distribution of executed volume, not by the precise identity of each aggressor. A trader who needs single order precision is running a latency sensitive strategy, and that trader is not learning from a retail chart anyway.
Any mentor who tells you a retail footprint is exact is either not reading the documentation or is hoping you will not.
Here is what I see constantly. A trader buys the subscription, opens a footprint chart, and stares at a wall of numbers. Then they conclude the tool does not work.
The tool works. The reading framework is missing.
A footprint without structural context is a spreadsheet. You need to know what the level is, what the higher timeframe is doing into it, and what the auction did on its previous visit, before a delta number carries any meaning at all.
Most available content teaches the display and skips the decision. You are shown what an imbalance looks like and never taught what makes one worth acting on and another worth ignoring.
Content that teaches you to buy data before it teaches you to read a candle has the sequence backwards. That is the approach I object to, and it is a teaching failure before it is anything else.
Screen time cannot be purchased. No subscription shortens the period where you read badly before you read well.
Kumar Singh Global Trading Academy teaches order flow and volume footprint as a structured discipline, built on a zero indicator philosophy. Pure structure. Real markets. Zero indicators.
NIC Pro is the flagship programme, and it is delivered in two formats.
Direct personal mentorship, with the pace set by your progress rather than by a fixed batch calendar.
Your own charts and your own trades reviewed, which is where most of the actual learning happens.
Questions answered until the concept holds, not until the session clock runs out.
Live group sessions covering the same curriculum, with the added benefit of watching other traders work through the same problems.
A peer cohort, which matters more than most people expect when you are learning to read auctions.
Twenty four proprietary modules across six phases, moving from order flow based price action through to advanced execution models.
Written study material accompanies the modules, including confidential method books produced for mentorship members.
Coverage runs from foundation to advanced. Auction basics, footprint anatomy, volume profile, delta behavior, structural context, zone logic, and advanced execution frameworks.
Proprietary frameworks developed over years of independent market reading, taught in live sessions rather than published publicly.
Lifetime mentorship support is available as an enrollment add on for traders who want continuity after the program.
What is deliberately not offered. No tips. No signals. No calls. No managed accounts. No claims about what you will earn. This is education, and it is structured as education.
Traders in India working on NSE, BSE and MCX instruments who want the auction logic rather than another indicator package.
International traders, since order flow and footprint reading are exchange agnostic. The auction behaves the same way on Nifty, on the S&P complex, on FX futures and on Crypto. Sessions are conducted in English, with Hindi available where preferred.
Traders who have already bought courses and still cannot read a chart independently.
Anyone who wants to understand why price stopped where it stopped, rather than being told where it will go next.
Kumar Singh Global Trading Academy (OPC) Private Limited is an education provider. All content, courses, mentorship programs and written material are produced for educational and informational purposes only.
We are not registered with the Securities and Exchange Board of India or any financial regulatory authority worldwide. We are not investment advisers, research analysts, portfolio managers or brokers, and we do not hold registration in any such capacity in any jurisdiction.
Nothing in this article constitutes investment advice, a recommendation, a solicitation, or an offer to buy or sell any security, derivative, commodity or other financial instrument. We do not provide buy or sell calls, trading tips, signals, or portfolio management services, and we do not manage funds on behalf of any person.
Trading and investing in securities, derivatives and commodities carry a substantial risk of loss and are not suitable for every person. A majority of retail participants trading in derivative products incur net losses. You may lose part or all of your capital. Past market behavior does not guarantee or indicate future results.
No representation, assurance or guarantee of profit, income, return or performance outcome is made or implied by this article, by any program we offer, or by any material we publish. Any results described by individual students reflect their own experience and are not typical, not verified as representative, and not a promise of similar outcomes.
Third party platforms, data vendors and brokers are referenced for educational comparison only. We hold no commercial arrangement with them, we do not endorse them, and their features, pricing and data availability may change. Verify current specifications directly with the provider before subscribing.
Readers are solely responsible for their own trading and investment decisions and should consult an appropriately registered financial professional in their own jurisdiction before acting on any information. Participants outside India are responsible for compliance with the laws and regulations applicable in their own country.
What Indian traders ask about footprint charts, CME data, heatmaps, and what mentorship actually costs.
No. CME data covers contracts listed on CME Group exchanges. Indian instruments such as Nifty, Bank Nifty and NSE stock futures are matched on Indian exchanges, and their order flow exists only in Indian exchange data. CME feeds are useful for macro context on globally correlated commodities. They contain no order flow information about any Indian instrument.