We Teach Trading — Zero Tips, Zero Advice, Zero Recommendations. Not registered with SEBI or any financial regulator worldwide.
We Teach Trading — Zero Tips, Zero Advice, Zero Recommendations. Not registered with SEBI or any financial regulator worldwide.
Three decades of reading pure price and volume, turned into a practical filter. What these tools actually show, and how to judge any course before you spend a rupee on it.
Most people meet order flow through a thumbnail. A dark screen, a wall of numbers, an arrow pointing at the exact bar where price turned. It looks like a machine that tells you what happens next.
It is not that. It never was.
Order flow is the transaction record of a market. Four things are worth fixing in your head before anything else:
Every trade has two sides. There is no such thing as more buyers than sellers. Volume is always matched. Anyone who tells you otherwise has not thought about it carefully.
What varies is aggression. One side crosses the spread to get filled immediately. The other side waits. Order flow reading is the study of who was in a hurry, at which price, and whether that hurry accomplished anything.
It is backward looking. A footprint describes what has already been printed. It carries no forecast inside it. The forecast, if you make one, comes from your own reading of structure and context.
It is a magnifying glass, not a map. Order flow tells you what happened inside a bar. Market structure tells you where that bar sits. Without structure, the numbers are trivia.
That fourth point is where most people go wrong, and it is the reason so many courses fail their students. They sell the magnifying glass and never teach the map.
A standard candle gives you four numbers. Open, high, low, close. Everything that happened inside the bar is thrown away.
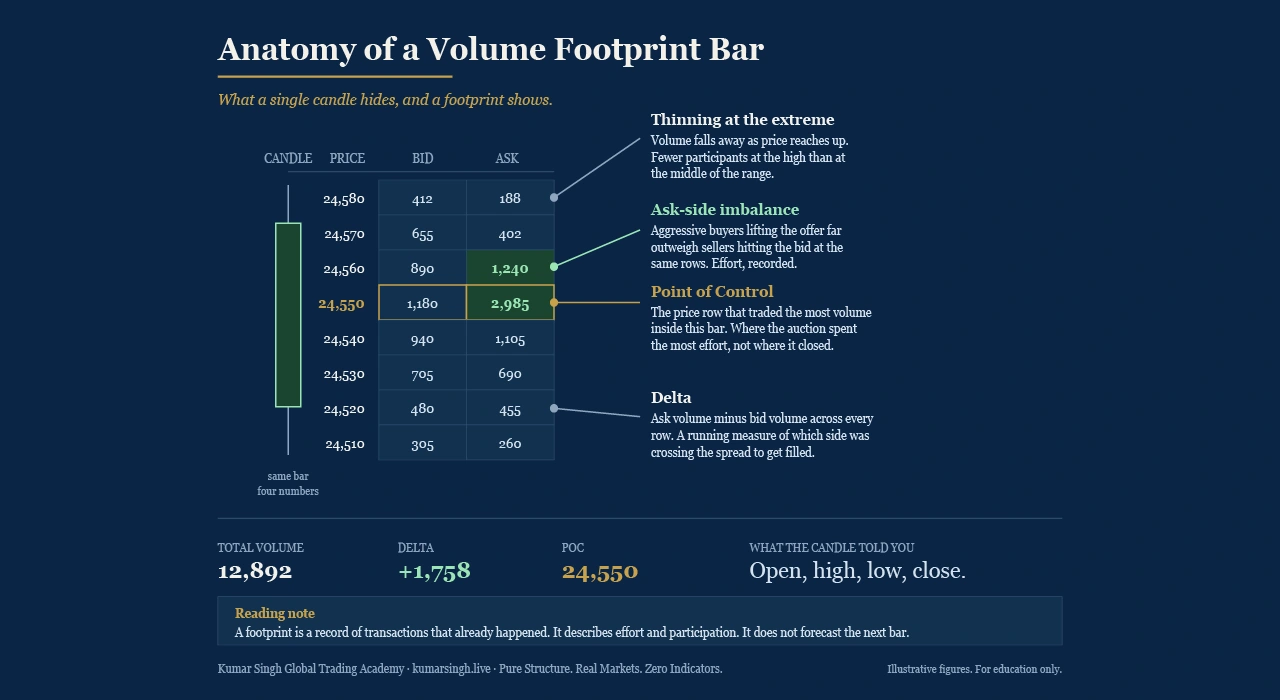
A footprint keeps it. Instead of one body, you get every price level the bar traded at, and how much volume changed hands at each one, split by which side of the spread it hit.
The vocabulary is small. Learn these six and you can read any footprint chart on any platform:
Bid volume. Contracts filled at the bid. Sellers hitting the offer of a resting buyer.
Ask volume. Contracts filled at the ask. Buyers lifting the offer of a resting seller.
Delta. Ask volume minus bid volume. A running count of which side was doing the crossing.
Point of Control. The price row inside the bar that traded the most volume. Where the auction spent the most effort, which is often nowhere near where the bar closed.
Imbalance. A significant lopsidedness between the bid and ask volume at adjacent price levels. Effort, made visible.
Unfinished auction. A bar that ends at its extreme without a proper two-sided trade there. The market left something incomplete.
The diagram below is a single bar taken apart. Same bar, two views.
Look at what the candle version told you. The bar closed higher. That is it. The footprint tells you the heavy trade happened at 24,550, well below the high, and that participation thinned out badly as price pushed up. Same bar. Very different picture.
Learning to read that difference takes months of screen time. Learning the six words above takes an afternoon. Courses that sell you the afternoon and call it a method are the problem this article is about.
Let me be precise here, because this gets misread. There is useful content on YouTube. What there is very little of is teaching. The two are not the same thing, and the format itself explains why.
Commentary describes, it does not instruct. A person narrating a chart is telling you what they see. You are watching someone read. You are not learning to read.
The clip you are watching is the one that worked. Nobody uploads the session where the setup failed and the reasoning was wrong. You are looking at a filtered sample and forming beliefs from it.
Hindsight is baked into the frame. When the chart is already complete, every level looks obvious. Point at a turn on a finished chart and it will always look like it was announced in advance. It was not.
There is rarely a falsifiable rule. If a condition cannot be stated precisely enough to be wrong, it cannot be tested, and if it cannot be tested you have not been taught anything. You have been given a mood.
The incentive is the watch time, not your progress. A video is rewarded for holding attention. A teacher is rewarded when the student no longer needs them. Those two incentives pull in opposite directions.
Confidence reads as competence on camera. Fluency, good lighting and a certain tone of voice are production skills. They tell you nothing about whether the person can trade or teach.
Use YouTube for exposure. Use it to find out who exists, how they think, whether their approach interests you. That is a real and useful function. Just do not confuse having watched two hundred videos with having learned a method. Those are different activities, and only one of them changes what you can do at 9:15 in the morning.
This list is not about me. Apply it to my programs as hard as you apply it to anyone else. If a course cannot survive these eight questions, it is not worth your money regardless of who is selling it.
Can the teacher state one entry condition precisely enough to be wrong? Ask for a single rule with specific conditions attached. Vague language here is the loudest signal there is.
Am I being taught to read the chart, or to copy the call? A course that leaves you dependent on the teacher for every decision has sold you a subscription, not a skill.
Is the teaching live? Recorded material is fine for foundations. But markets are live, and a method that has only ever been demonstrated on a replay has not been demonstrated.
Is failure part of the curriculum? Every method has conditions where it does not work. If the teacher cannot describe those conditions in detail, either they do not know or they will not say.
What data and platform do I need, and was that told to me upfront? Footprint charts need tick-by-tick data with bid and ask separation. Not every feed provides it and it is often a paid subscription on top of the course. If this was hidden until after payment, that tells you something.
Have I been shown a losing example in full? Not a quick mention. The complete sequence, including what the teacher was thinking when it went wrong.
Can I reach the person who taught it? Or does the trail end at a support desk and a community manager?
What exactly am I buying? A skill I will still have in five years, or access to somebody else’s opinion that expires when I stop paying?
Some of these are commercial red flags. One is a regulatory one, and it matters more than people realise.
Profit and loss screenshots. Unverifiable, trivially edited, and legally problematic in most jurisdictions. Their presence is information about the seller.
Income or outcome language. Any promise about what you will earn. In India this crosses into territory that requires regulatory registration, and similar rules exist across the US, UK, EU, Australia and Singapore.
Manufactured urgency. Countdown timers, seats disappearing, prices rising at midnight. Real teaching has capacity limits for real reasons and says so plainly.
A method that gets renamed every quarter. A framework that keeps changing its name is usually a framework that keeps changing its substance.
No mention of the data requirement. Covered above. It is the single most common omission.
Silence about who the teacher is accountable to. Look for a registered entity, a real address, a working contact, filings you can check.
Advice dressed as education. This is the important one. Anyone giving specific buy or sell recommendations on securities in India must be registered with SEBI. Education about method is a different activity from advice about positions. Know which one you are buying, and check the seller’s registration status before you decide.
It is slower and less exciting than the marketing suggests. Here is the honest shape of it:
Structure comes before execution. You learn to read where the market is before you learn to read what is happening inside a bar. Reversed, the numbers mislead you constantly.
Screen time is the curriculum. There is no substitute and no shortcut. The modules give you the framework. The hours in front of live data give you the reading.
You learn to be wrong properly. Being wrong quickly, at a defined level, for a reason you can state afterwards. This is a skill and it is teachable.
A small number of concepts, held deeply. Traders who last do not run twenty setups. They run a few, and they know them cold.
The process is written down. A journal that records the reasoning, not just the result. Over months this is what turns experience into knowledge.
The teacher is present when the market is. Live sessions, live questions, live mistakes. Including the teacher’s.
Nothing is added that does not earn its place. No indicator, no overlay, no dashboard, unless it does something price and volume cannot already tell you. Usually it does not.
NIC stands for No Indicator Concepts. It is the methodology I built over three decades of independent research, and the name is literal. No moving averages, no oscillators, no signal packages. Price, volume, and market structure, read directly.
The reasoning is simple. Every indicator is a transformation of price and volume, computed after the fact. If you can read the source, you do not need the derivative, and the derivative always arrives late.
NIC Pro
The full programme runs 24 modules across 6 phases, structured as a journey rather than a menu. Core NIC frameworks come first, covering market structure, candle body and wick psychology, volume candles, institutional order flow and footprint reading, and periodic volume profile research.
Advanced Execution Models sits on top of that foundation as a later phase, containing four proprietary models built specifically around footprint and fixed range volume profile execution. Those models are taught live and in full to enrolled members. The specific conditions are not published, and that is deliberate.
Pro Desk
Live desk sessions for members who want reading practice alongside the curriculum, including one-hour skill upgrade sessions on any single concept the trader chooses.
Free Sunday Session
An open Google Meet, 9 PM IST every Sunday. No payment, no pitch deck, no obligation. Come and watch how the method is taught before deciding whether it is for you. This has run for over a year and it is the honest way to evaluate what I do.
You should not take this on assertion. Here are the specifics, and every one of them is something you can verify or test before paying anything:
Reading markets since 1994. Over three decades in front of price, across multiple market regimes and multiple crashes.
The method was built, not bought. NIC was developed through independent research, not assembled from other people’s courses. The frameworks are original.
Students across five continents. Traders learning from India, the Gulf, Europe, North America and Australia, in both English and Hinglish.
Taught live, personally. I take the sessions. Not a team, not a recorded library with a support inbox attached.
An audit trail that exists. Kumar Singh Global Trading Academy (OPC) Private Limited is a registered Indian company. The NIC and NIC Pro frameworks are the subject of filed trademark applications. You can check all of it.
Proprietary frameworks that are actually proprietary. Engulf Cycle Strategy, Mother Candle Logic, Ascending and Descending Market Structure, the Institutional Order Flow and Volume Footprint framework, Parallel Channel Structural Forecasting, Institutional FVG Framework, and the Advanced Execution Models. Named, defined, and taught.
A free route in, permanently. The Sunday session costs nothing and has no upsell attached. Evaluate the teaching before you evaluate the price.
Direct access. Every enquiry gets a reply from me. That has been true since before there was a company attached to it.
Attend the free Sunday session. 9 PM IST, every Sunday, on Google Meet. Cost nothing, commit nothing, judge for yourself.
Apply the eight questions above. To my programs and to every other one you are considering.
Then decide. NIC Anchor Flow as a self-paced foundation, or NIC Pro for the full live mentorship.
Website: kumarsingh.live
Email: ksingh@kumarsingh.live
Phone: +91 9999866089
Kumar Singh and Kumar Singh Global Trading Academy (OPC) Private Limited are not registered with SEBI or any financial regulatory authority worldwide.
All content on this page is provided strictly for educational purposes. Nothing here constitutes investment advice, a recommendation, a solicitation, or an offer to buy or sell any security, derivative, currency or other financial instrument. No representation is made regarding the suitability of any method for any individual.
Trading in financial markets carries a substantial risk of loss and is not suitable for every person. Past market behaviour does not indicate future market behaviour. Any figures shown in diagrams on this page are illustrative and constructed for teaching purposes only.
Readers are responsible for their own decisions and should consult an appropriately registered and qualified professional in their own jurisdiction before acting on any information.
© Kumar Singh Global Trading Academy (OPC) Private Limited. NIC™, NIC Pro™ and associated frameworks are proprietary.
Straight answers on what a footprint chart shows, what it cannot do, the data it actually needs, and how long the reading takes to learn.
Order flow trading is the practice of reading the transaction record of a market, specifically which side of the spread was crossed at each price level, in order to understand where buying and selling effort occurred. It is a method of reading what has already happened, not a predictive signal.