We Teach Trading — Zero Tips, Zero Advice, Zero Recommendations. Not registered with SEBI or any financial regulator worldwide.
We Teach Trading — Zero Tips, Zero Advice, Zero Recommendations. Not registered with SEBI or any financial regulator worldwide.
Order flow is not a strategy. It is the reality of trading. See the bid, the ask, the auctions, and the institutional zones that move price. This is how NIC teaches traders to read markets.
Look at any retail screen. Green candle, red candle. Up, down. A moving average crossing another moving average. An oscillator bouncing off some line a textbook drew thirty years ago.
Here is the uncomfortable part. Every one of those tools is built from price that already happened. Indicators are derivatives. They take the move, smooth it, lag it, and hand it back to you late. By the time the signal prints, the people who actually moved the market are already positioned. You are reacting to their footprints while they are counting the money.
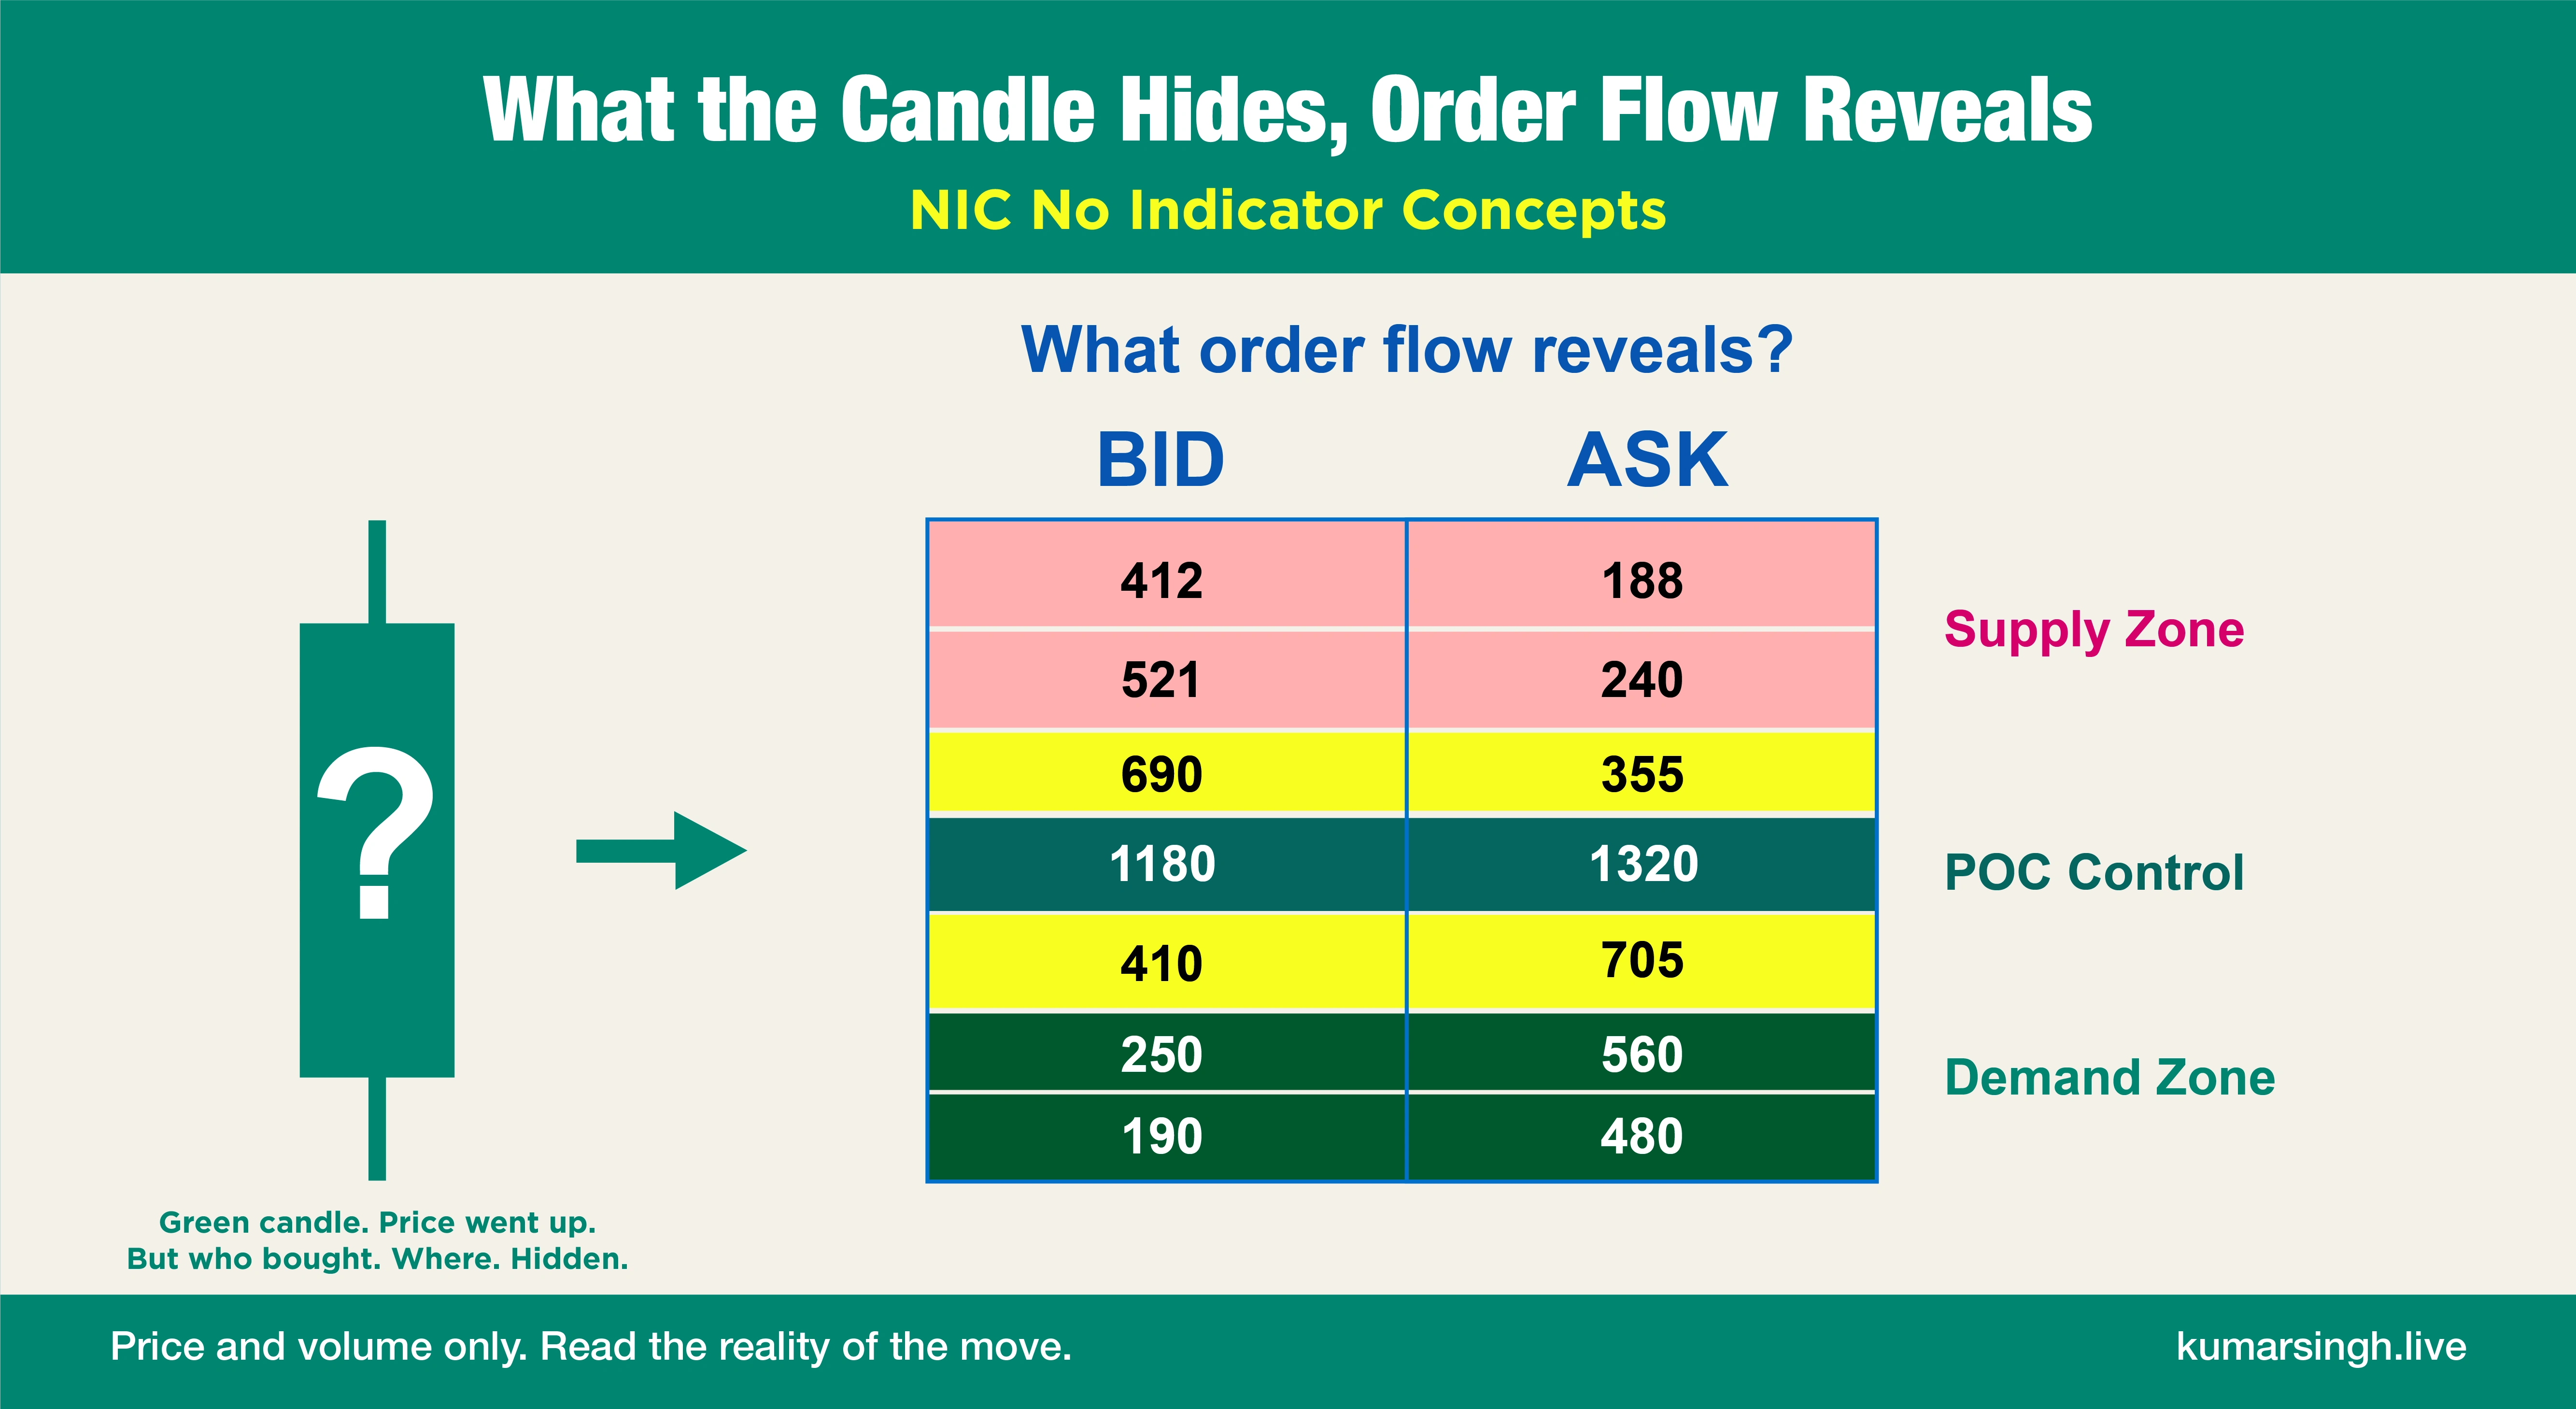
A candle tells you the open, the high, the low, the close. It does not tell you who bought. It does not tell you where the buying dried up. It hides the fight that happened inside it. That is the gap most traders never close.
Order flow is not a concept you bolt onto a chart. It is the raw record of intent. Every contract that trades leave a mark, and order flow lets you read those marks in real time.
When you trade order flow you are watching the bid and the ask. You see market depth. You see where aggressive buyers are lifting offers and where aggressive sellers are hitting bids. You see the zones where market makers absorb size and the zones where they step away. You see which side actually strong and which side is trapped and about to give up.
That changes the question you ask. You stop asking is the candle green. You start asking who is winning this move, and at what price are they losing control. The red and green stops being the headline. The flow underneath becomes the story. Rule based. Disciplined. Built on what the market is doing right now, not on a lagging line.
A footprint chart opens the candle up and shows you the auction that built it. Instead of one colored body, you see the volume that traded at every single price inside that range, split between buyers and sellers.
Now the point of control becomes visible. The price where the most volume changed hands. The level the market kept returning to. You can see where an auction finished cleanly and where it left business undone. You can see acceptance and rejection at a price, instead of guessing at it.
The full method for reading a footprint cleanly, the way the rows are calibrated and the way the prints are sequenced, is the part traders learn directly inside NIC Pro. The concept is simple to state. The skill is in the reading.
Here is something most courses get backwards. They obsess over timeframes. Five-minute, fifteen minutes, hourly, daily, as if the clock decides the trade.
The market does not care about your timeframe. It cares about price. It moves between zones where decisions were made, where large orders sit waiting, where supply met demand and one of them won. A five minute chart and an hourly chart are looking at the same auction. The zone is the truth. The timeframe is just the lens you happen to be holding.
Once you accept that, your whole map changes. You stop chasing candles across timeframes and you start watching how price behaves when it arrives at a zone that matters.
Retail draws support and resistance with a flat line and a hope. Institutions do not work that way. They build positions in zones, in size, often quietly, and they leave evidence behind in the order flow.
Learning to identify a valid institutional supply or demand zone is the edge. Not a line you drew because price touched it twice. A zone where you can see, through footprint and flow, that real participants committed real size and defended it. When price returns to that zone, you are no longer guessing. You are reading whether the same participants are still there, still strong, or whether the zone is about to fail.
Order flow tells you what is happening. The institutional zone tells you where it matters most. Put them together and you are reading the two things that actually drive price.
NIC, No Indicator Concepts, was built by Kumar Ravishanker Singh, professionally known as Kumar Singh, on one conviction held since 1994. Only price and volume matter. Everything else is a derivative of those two.
NIC takes order flow, volume footprint, and institutional zone reading and trains them as one connected skill, not three separate gadgets. You learn to see the bid and ask, read the auction inside the candle, locate the zones where institutions actually positioned, and judge which side is winning before the move is obvious on a normal chart.
The specific rules, the calibration, the entry and exit logic, those are taught live, in sequence, because that is the only way a skill like this transfers. This article gives you the map. The live teaching gives you the reading.
When you can see who is buying, who is selling, who is strong, who is trapped, and where the institutional zones sit, your decisions change in character. They become informed. They become rule based. They stop depending on a green candle and start depending on what the order flow is telling you.
That is the whole point of trading reality instead of trading colours. Not a magic signal. A clearer view of the market, so the trader carries the discipline and the read, and acts on evidence instead of hope.
This applies across global assets, because order flow is the language every liquid market speaks. Indices, commodities, currencies. The instrument changes but the reality does not. Price and volume. Bid and ask. Auction and zone.
That is order flow and volume footprint trading. Not a strategy you switch on. The reality you finally start to see.
This content is for educational purposes only. It is not investment advice and contains no buy, sell or hold recommendations on any security. Kumar Singh Global Trading Academy and Kumar Ravishanker Singh, professionally known as Kumar Singh, are not registered with SEBI or any financial regulatory authority worldwide. Trading involves substantial risk. Make your own decisions and consult a registered professional where required.
Straight answers to the questions traders ask most about order flow, volume footprint charts, and reading institutional zones without indicators.
They answer different questions. A candlestick shows the open, high, low and close after the fact. Order flow shows the buying and selling that built that candle while it is happening, including the bid, the ask and market depth. Many traders use candles for context and order flow to read what is actually driving the move.
A footprint chart displays the volume traded at each individual price inside a candle, split between buyers and sellers. It reveals the point of control, the price where most volume traded, and shows where an auction was accepted or rejected. It turns a single coloured candle into a detailed picture of the auction underneath.
No. Order flow reads the raw market itself. The bid, the ask, depth and traded volume. That is the foundation of NIC, No Indicator Concepts. Indicators are derived from price and arrive late. Order flow is the price action and the participation, read directly.
They are price areas where large participants build or defend positions in size, leaving evidence in the order flow and footprint. Unlike a simple support or resistance line, a valid institutional zone can be confirmed by reading the flow and volume that formed it, which makes it a far stronger reference point.
Yes, with structured guidance and screen time. The concepts are straightforward to understand. The skill is in consistent reading, which is why NIC teaches them live and in sequence rather than as a set of tips. Begin with the foundations, then build toward footprint and zone reading.