We Teach Trading — Zero Tips, Zero Advice, Zero Recommendations. Not registered with SEBI or any financial regulator worldwide.
We Teach Trading — Zero Tips, Zero Advice, Zero Recommendations. Not registered with SEBI or any financial regulator worldwide.
Most traders look at footprint charts and see numbers. Institutional traders look at the same chart and see intent, pressure, and the next move — before it happens. This article teaches you what separates the two.
Footprint charts are not complicated tools. They become complicated when you approach them with the wrong mental framework. The majority of retail traders open a footprint chart and immediately start searching for patterns - looking for something to confirm what they already believe about the market.
This is the first mistake. Pattern recognition without understanding the mechanics of what created that pattern is noise-reading, not order flow reading.
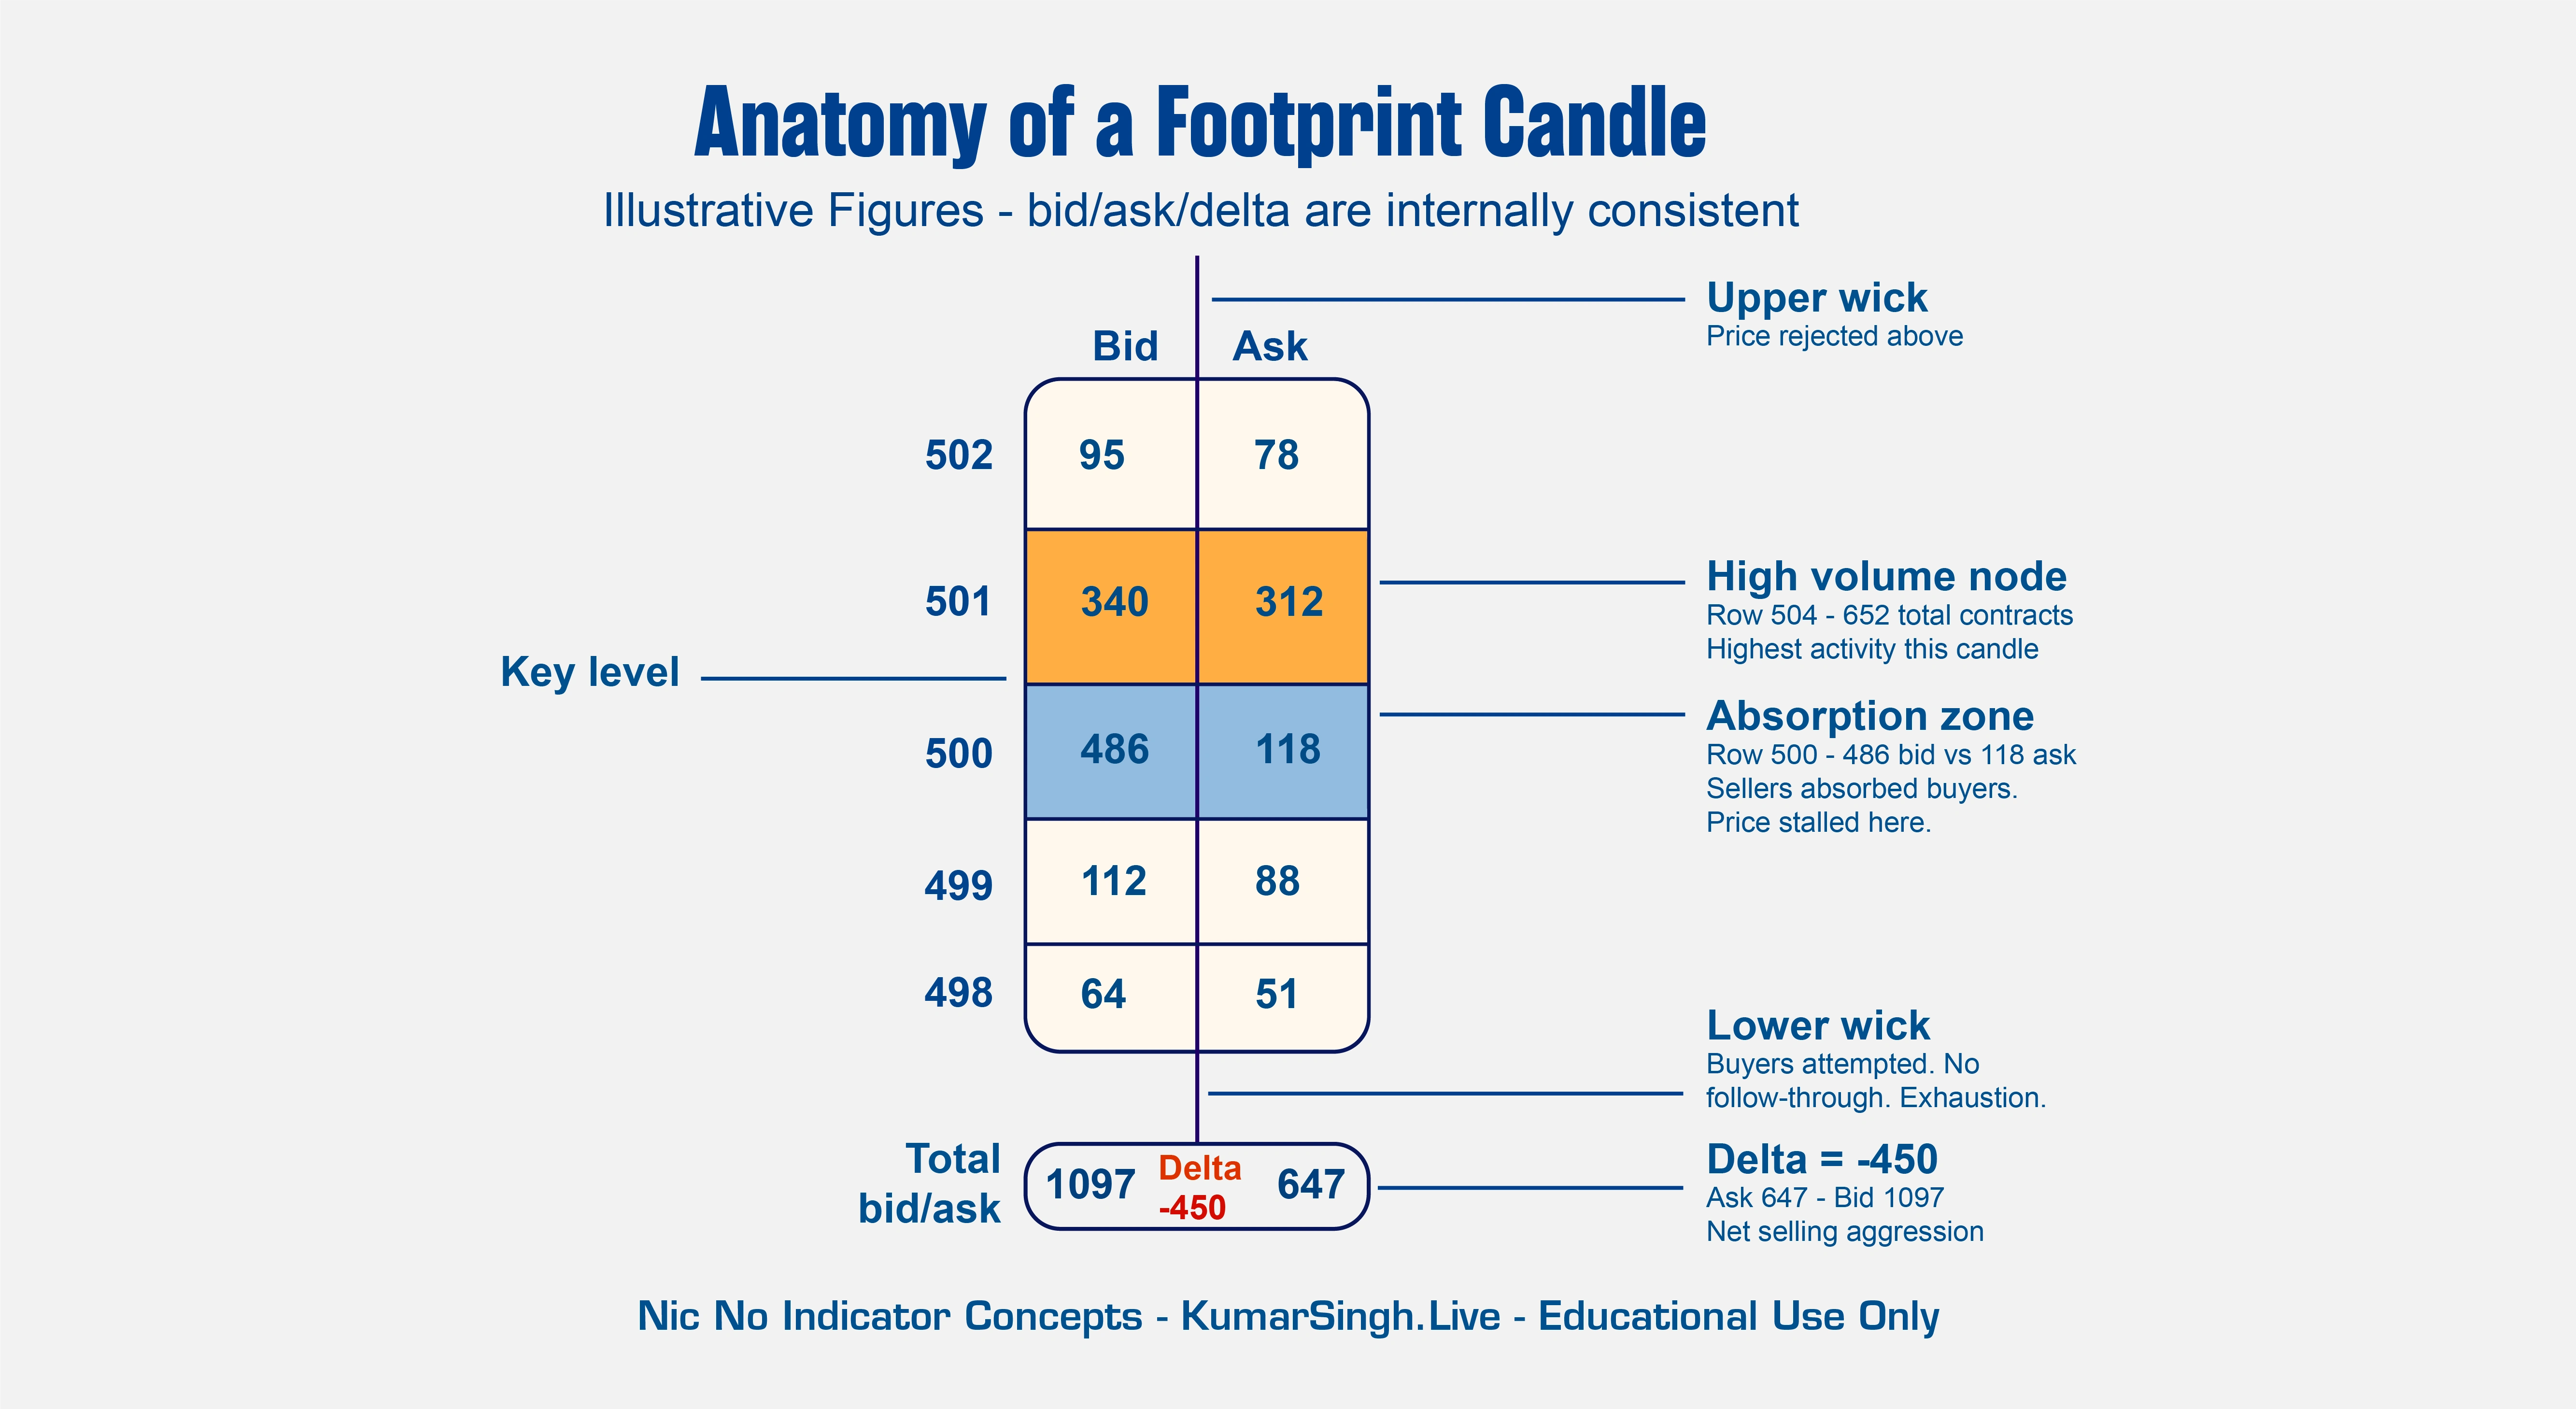
Footprint charts display transacted volume at every price level within a candle. Every bid absorbed, every offer lifted - it is all recorded. When you understand that each number on that chart represents real capital that real participants committed, the way you look at it changes permanently.
The psychology of reading footprint charts is not about spotting a formation. It is about understanding what participants were doing, whether they were in control, and whether that control held or broke.
Volume footprint analysis tracks the relationship between buyers and sellers at each price level in real time. It does not predict. It reveals what has already happened at the microstructure level, which is information most retail traders never see.
When you see large, traded volume at a price level, the question is never just how much. The question is who was in control at that level and did they absorb the opposing pressure or did they fail.
Absorption occurs when one side - buyers or sellers - takes on significant opposing flow without the price moving against them. This is a signature of institutional activity. They are not chasing price. They are building or defending a position.
Understanding absorption is central to the NIC No Indicator Concepts methodology. The market leaves these traces because large participants cannot hide their footprint completely. They can obscure timing, but not the transacted record.
Exhaustion is the opposite. It occurs when one side pushes price into an area and the volume confirms diminishing follow-through. Price reaches a level, volume is present, but the move stalls or reverses. This is the market telling you the aggression has run out of fuel.
Recognizing exhaustion before it completes is one of the most powerful skills in order flow trading. It requires reading sequential footprint data, not single candle snapshots.
Retail traders are trained, often unconsciously, to look for signals. They want the chart to tell them what to do. Institutional thinking is different. Institutional traders use the chart to confirm or deny what the market structure is already suggesting.
This distinction matters. When you search for a signal, you are reactive. When you read order flow to confirm or deny a structural thesis, you are proactive. You already know what you are looking for before the footprint chart opens.
NIC No Indicator Concepts is built entirely on this mental model. The methodology teaches traders to develop a structural read first - understanding where the market has been, where it has returned to, and why that matters - and then use volume footprint data to validate or invalidate that read.
Delta is the difference between buying and selling volume within a candle or at a price level. It is one of the most misused metrics in order flow trading.
Retail interpretation of delta is almost always directional. Positive delta means buyers are in control. Negative delta means sellers are in control. This interpretation is incomplete and frequently misleading.
Large positive delta on a candle that closes near its low is not a bullish signal. It is a signal that aggressive buyers were absorbed by passive sellers at that level. The market took their liquidity and went nowhere useful with it. That is structural information, and it is bearish in context.
The psychology here is critical. Delta tells you the direction of aggression. It does not tell you who won. To understand who won, you need to look at where price closed relative to the range of that footprint candle, and what happened at the levels where the volume was concentrated.
This is a more demanding cognitive process than indicator reading. It requires you to hold multiple data points simultaneously and weigh them against structure. That is exactly why most traders never develop this skill, and why it remains an edge.
No indicator tells you this. Price and volume are the only inputs that are not derivatives of price and volume. Everything else is lag.
One of the foundational principles inside NIC Pro is that footprint charts are confirmation tools, not discovery tools. You do not open a footprint chart to find a trade. You open it to understand whether the structure you have already identified is being respected, tested, or broken.
Structure in this context means the levels where the market has previously shown that significant participants were active. Areas where price reversed sharply. Areas where volume was anomalous. Areas where the market spent time but then left decisively.
Volume footprint analysis at these structural levels tells a story that no indicator can replicate. When price returns to a level and the footprint shows aggressive absorption, that is a different market condition than when price returns and the footprint show thin, indifferent volume. The response required from you as a trader is entirely different in each case.
This is what NIC No Indicator Concepts teaches at the advanced level: not how to read a footprint chart in isolation, but how to integrate volume footprint data into a complete structural framework for reading what institutional participants are doing in real time.
Confirmation bias: Traders who already have a directional bias look at footprint data selectively. They notice the data that supports their view and discount what contradicts it. The solution is to look at the footprint before forming a directional bias, not after.
Recency bias: Giving excessive weight to the last candle or the last few minutes of footprint data, ignoring the larger sequence. Footprint charts are sequential by nature. One candle does not tell you the story. The relationship between candles does.
Volume magnitude bias: Assuming that large volume is always significant. Volume is only significant in context. Large volume at a level that subsequently accepts price is different from large volume at a level that rejects price. The magnitude is the same. The meaning is opposite.
Speed bias: Making decisions faster because more data is visible. Footprint charts can overwhelm traders into thinking they need to act immediately. The edge comes from reading more accurately, not more quickly.
The NIC No Indicator Concepts methodology was developed through independent market research spanning decades, with a specific focus on how institutional order flow manifests in price and volume data across Indian and global markets.
NIC Pro, the advanced mentorship program at Kumar Singh Global Trading Academy, covers volume footprint analysis as part of an integrated framework that includes institutional order flow, market structure, and a proprietary approach to reading how significant participants build, defend, and exit positions.
The methodology does not use indicators. It does not use derivatives of price. Every input is price and volume, read at the level of the transaction record. This is what the NIC in NIC No Indicator Concepts means in practice, not just in name.
Traders who complete the NIC Pro curriculum develop the ability to read what is happening in the market at the level that institutions operate, not at the level that retail trading tools are designed to show.
Reading footprint charts well is a skill with a high learning curve and a significant edge once developed. It requires you to unlearn most of what retail trading education teaches, specifically the idea that tools find trades for you.
The market is a record of decisions made by capital. Footprint charts are the most granular available record of those decisions at the transacted level. Learning to read them accurately, within the correct structural framework, is one of the most valuable things a serious trader can develop.
The starting point is not software. The starting point is the mental framework. Understanding what you are looking at, what questions to ask, and how to weigh the answers - that is the psychology of reading footprint charts. Everything else is mechanics.
For educational and informational purposes only. Kumar Ravishanker Singh and Kumar Singh Global Trading Academy (OPC) Private Limited are not registered with SEBI or any financial regulatory authority worldwide. Nothing in this article constitutes investment advice, trading recommendations, or an offer to buy or sell any financial instrument. Trading involves substantial risk of loss. Past performance is not indicative of future results. Consult a qualified financial advisor before making any trading decisions.
Real questions from traders learning to read order flow and volume footprint for the first time.
A footprint chart displays the actual volume transacted at each price level within a candle, showing both bid and ask activity. A standard candlestick shows only open, high, low, and close — no transaction-level data. Footprint charts reveal the microstructure of each candle, allowing traders to see where volume was concentrated, which side was aggressive, and whether absorption or exhaustion occurred at key levels. This is why volume footprint analysis is used in institutional and professional order flow trading, not retail indicator-based trading.
Delta in footprint analysis is the net difference between buying volume (trades executed at the ask) and selling volume (trades executed at the bid) within a specific candle or price level. Positive delta indicates more aggressive buying. Negative delta indicates more aggressive selling. However, delta must always be interpreted in context — large positive delta on a candle that closes weak is not bullish. It indicates that buyers were absorbed by passive sellers at that level, which is a bearish structural signal. Delta direction is not the same as delta outcome.
Yes. Volume footprint analysis is applicable to any liquid market where transacted volume data is available at the tick level. NSE and BSE provide this data. The principles of institutional order flow, absorption, and exhaustion visible in footprint charts apply equally to Indian equity and derivatives markets. The NIC No Indicator Concepts methodology has been developed with specific attention to how these dynamics manifest in Indian market conditions, including session structure, derivative expiry cycles, and the behavior of institutional participants in the Indian context.
Developing genuine competence in footprint chart reading typically requires months of structured study and live market observation, not days. The cognitive demands are significantly higher than indicator-based trading because you are processing multiple layers of data simultaneously and weighing them against structural context. Traders who attempt to learn footprint reading through YouTube clips or surface-level content typically develop pattern-recognition habits without understanding the underlying mechanics, which leads to inconsistent results. Structured mentorship under an experienced order flow trader, such as the NIC Pro program, significantly compresses the learning curve because the framework is taught systematically rather than assembled from fragments.