We Teach Trading — Zero Tips, Zero Advice, Zero Recommendations. Not registered with SEBI or any financial regulator worldwide.
We Teach Trading — Zero Tips, Zero Advice, Zero Recommendations. Not registered with SEBI or any financial regulator worldwide.
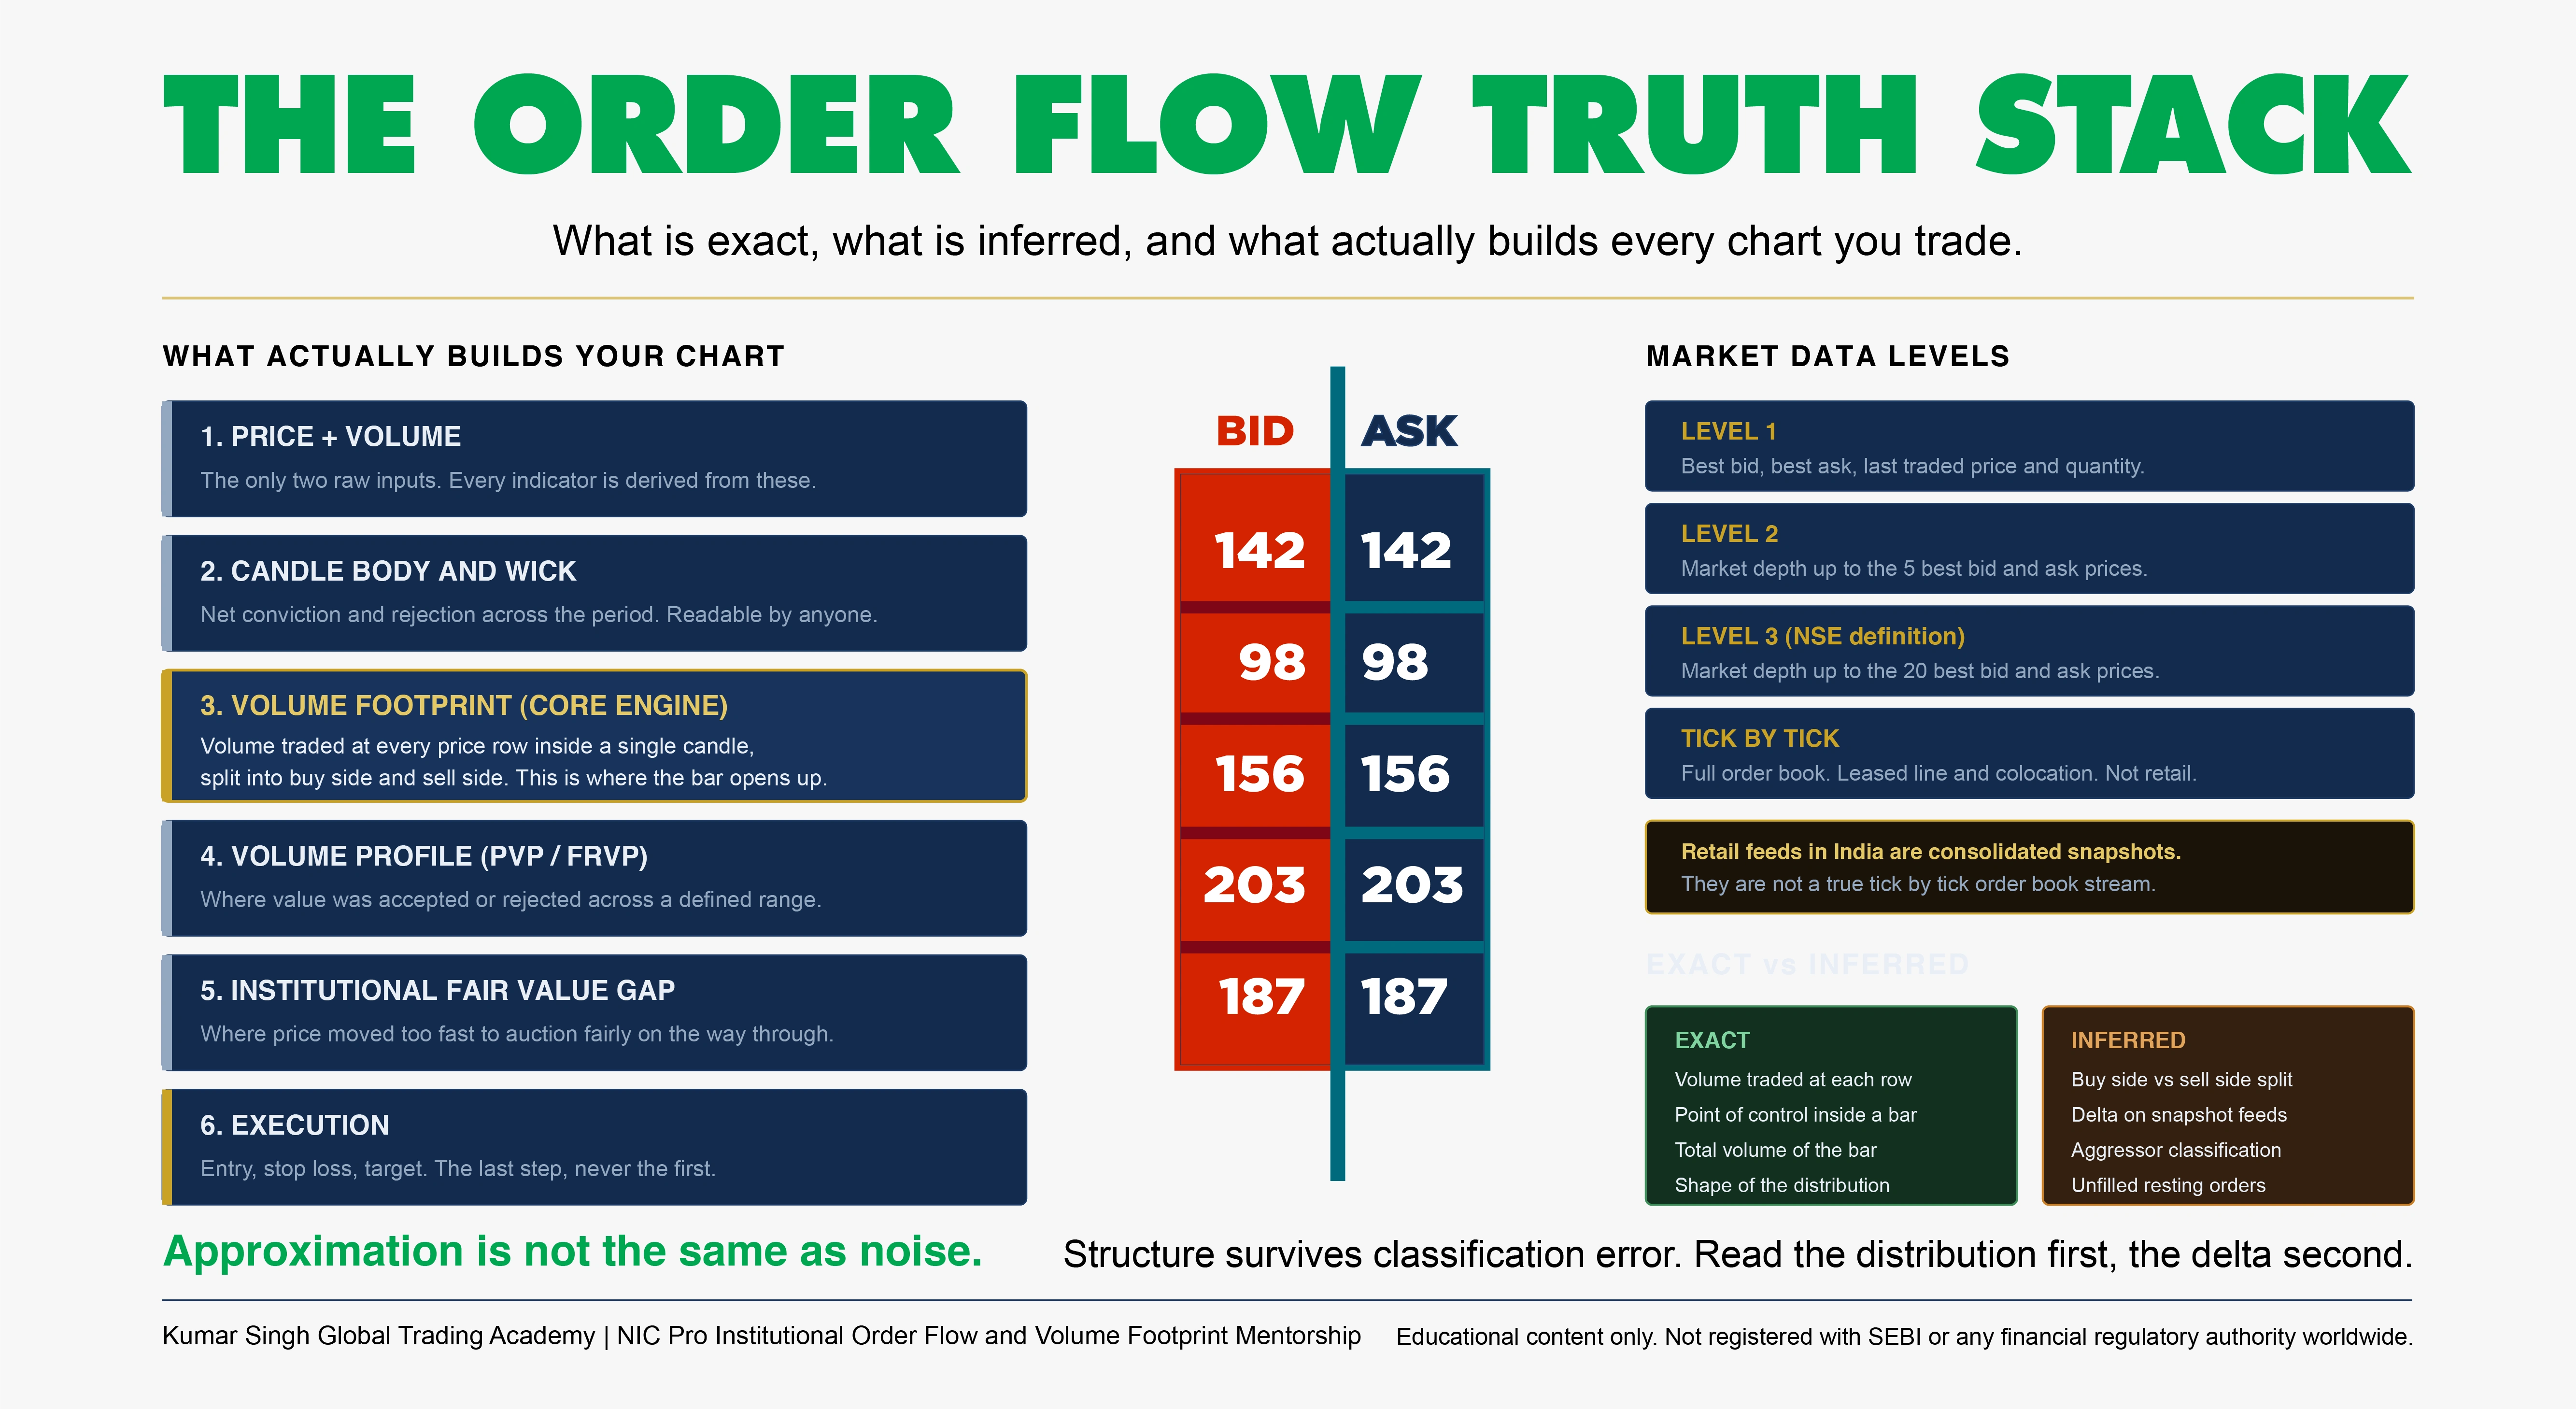
Indian brokers call footprint data an approximation and walk away from the conversation. Here is what is genuinely exact inside a footprint chart, what is honestly inferred, and why knowing the difference decides whether you read the market or guess at it.
By Kumar Singh. Reading markets independently since 1994, and the architect of the 24 module NIC Pro curriculum across six phases, including the Institutional Order Flow and Volume Footprint 1-2-3 Formula and the advanced execution models ABR, RZF, FRVP and PRM, plus the Virgin Zone models VZF and VZC. Founder of Kumar Singh Global Trading Academy, mentoring traders on five continents through NIC Pro live one to one and group programs.
I have spent more than three decades reading markets without a single indicator on my screen. In that time I have watched one argument get recycled again and again in India, usually by people who sell trading and rarely by people who trade.
The argument goes like this. Footprint charts are an approximation, therefore footprint charts are useless, therefore order flow is a foreign concept that does not work here.
There is an old line for this in Hindi. Angoor khatte hain. The grapes are sour. When you cannot reach the fruit, you decide the fruit was never worth eating.
I want to do something more useful than argue. I want to put the actual data facts on the table, admit plainly which part of a footprint chart is inferred, show you which part is exact, and then explain why the exact part is the part that carries your edge. If you finish this article and still think footprint is noise, at least you will think it for the right technical reason.
Short version: the approximation claim is half correct about Indian retail data and completely wrong about the conclusion drawn from it.
Before we touch footprint, get this settled. Every concept, every strategy, every indicator, every idea you have ever read, bought or traded is built on two raw inputs. Price and volume. Nothing else enters a chart.
RSI, MACD, stochastics, moving averages. Mathematical transformations of past price.
VWAP and anchored VWAP. Price weighted by volume. Real participation, not a lagging formula.
Volume profile, market profile, footprint. Volume organized by price instead of by time.
Supply and demand, order blocks, fair value gaps. Price structure, named differently by different schools.
This matters because it kills the excuse that order flow requires an expensive setup, a mathematics degree and a research team. It does not. A trader needs to understand how price and volume behave together. That behavior is visible on a naked chart with red and green candles before you add a single tool on top.
The body shows net conviction over the period. Who finished in control.
The wick shows rejection. Price went there and was refused.
The relationship between body and wick across a sequence shows whether the move is being accepted or fought.
A trader who masters body and wick psychology is already reading price and volume behavior. That is real skill and it costs nothing but screen time. But there is a hard ceiling on it, and that ceiling is the reason footprint exists.
Take two green candles of identical size, identical total volume, identical open and close. On a normal chart they look the same. Inside, they can be opposite stories.
In the first, most of the volume transacted near the low of the bar. Buyers stepped in low and price was carried up on thin participation.
In the second, most of the volume transacted near the high. Price ran up and then a wall of supply met it at the top.
Same candle. Completely different implication for your next trade. The candle cannot show you this, because a candle only records four prices and one total. The distribution inside it is invisible.
Volume footprint is the core engine of order flow because it opens the candle and shows you the distribution the candle is hiding.
A footprint chart splits one candle into horizontal price rows. Each row reports the volume that transacted at that price, separated into the side that hit the ask and the side that hit the bid.
Volume at every price row. You see exactly where inside the bar the business got done.
Point of control inside the bar. The row that absorbed the most volume. The magnet level.
Imbalance and stacked imbalance. Rows where one side overwhelmed the other by a meaningful margin, and runs of such rows on the same side.
Absorption. Heavy volume printing at a level while price refuses to advance. Somebody large is sitting there filling.
Unfinished auction. A bar that closes at its extreme without trading both sides at that extreme. Business left undone.
Delta. The net difference between the two sides, per row and for the bar.
Here is where I will be more honest than most people selling order flow courses.
A footprint chart cannot tell you how many buyers or sellers are waiting at a price level with unfilled orders.
It cannot tell you whether those resting limit orders will be executed or pulled a millisecond before price arrives.
No tool can. Not a depth of market ladder, not a heatmap, not a colocated feed. An un-executed order is intent, and intent can vanish.
What footprint reports is transaction. Business that actually happened. That is the one category of market information nobody can fake, cancel or spoof after the fact. Which is precisely why I build execution around it rather than around the order book.
Now the part your broker skips. Understand the data levels and the approximation debate resolves itself.
Level 1. Best bid price, best ask price, last traded price and quantity, cumulative volume. Top of book only.
Level 2. Market depth up to the five best bid and ask prices, aggregated by price.
Level 3. Market depth up to the twenty best bid and ask prices, as the National Stock Exchange defines it in its own real time data documentation.
Tick by tick. The full order book as a sequence perfect stream. Every order added, modified, canceled and matched.
Important nuance almost nobody explains: in global convention, Level 3 usually means order by order data with individual order identity. On NSE documentation, Level 3 means twenty level depth. Same label, different meaning. Half the confusion in Indian order flow discussions comes from this one mismatch.
Tick by tick is disseminated by multicast over a dedicated leased circuit or inside the exchange colocation facility. It is consumed by high frequency firms, proprietary desks, arbitrageurs and market makers.
It is not a retail product. The bandwidth, the hardware stack and the colocation cost make it structurally unavailable to a retail trader, and most brokers cannot stream it to you even if they wanted to.
What retail receives from almost every Indian broker API and data vendor is a consolidated snapshot, typically sampled around one per second, with depth attached.
So when a broker says the data is not true tick by tick, they are telling you the truth. The problem is what they do next. They use that truth to bury the entire tool instead of explaining which part of it is affected.
Split a footprint chart into two categories and the whole debate collapses.
Exact, even on a snapshot feed:
Total volume of the bar.
Volume traded at each price row within the bar.
Which row is the point of control.
The shape of the distribution inside the bar.
Inferred, on a snapshot feed:
Which side was the aggressor on each trade.
Therefore the bid versus ask split within a row.
Therefore delta, which is derived from that split.
The aggressor side is reconstructed by classification logic, usually by comparing the trade price against the prevailing quote or the previous trade. It is a reasonable estimate. It is not a measurement.
Read the distribution first and the delta second. The distribution is measured. The delta on Indian retail feeds is estimated. Most traders do this backwards and then blame the tool.
Partly. And the honest answer is more useful to you than either side of the shouting match.
Where the brokers are right. On Indian cash and derivative retail feeds, delta and the bid ask split are inferred, not measured. Anyone who tells you otherwise is either lying or has never read an exchange data specification.
Where the brokers are wrong, first. Approximation is not the same as noise. The structural information in a footprint chart comes from where volume concentrated, not only from which side clicked. Misclassifying some trades shifts the delta number. It does not move the point of control row, and it does not erase a heavy volume shelf.
Where the brokers are wrong, second. An honest objection names the affected component. Saying the whole chart is meaningless because one derived number is estimated is not analysis. It is dismissal wearing the costume of analysis.
Where the brokers are wrong, third. There are venues where trade data carries the aggressor side natively. Major global futures and the large crypto venues publish it. On those instruments delta is not estimated at all. If the data quality genuinely bothered these critics, the recommendation would be to trade where the data is clean, not to abandon the method.
That last point is not theoretical. My students read footprint on global assets every trading day, on instruments where the data does what it claims to do.
This is where a lot of expensive order flow education fails. A trader learns to spot absorption and then starts buying every absorption signature on the screen.
Absorption at a random mid range level tells you almost nothing. Two large participants exchanged inventory. Fine. The market does that all day.
Absorption at a level that already mattered structurally is a different event entirely.
At a prior swing point that created the current leg.
At the edge of an institutional fair value gap, where price previously moved too fast to auction properly.
At a fixed range volume profile boundary, where value was accepted or rejected across a defined window.
At a periodic volume profile point of control carried forward from a prior session.
Footprint tells you what happened inside the bar. Price action tells you whether that bar was standing anywhere that matters. You need both, in that order. Context first, confirmation second.
This is the single biggest reason I teach order flow, footprint, volume profile and structural price action as one package inside NIC Pro rather than as separate products. Splitting them creates traders who can describe a chart beautifully and still cannot place a trade.
TradingView Volume Footprint. The native chart type sits behind the Premium tier and above. Free, Essential and Plus plans cannot load it. Community Pine indicators approximate similar output on lower tiers with reduced fidelity.
Full depth ladder and heatmap platforms. These need a tick by tick order book feed to be meaningful. On Indian instruments that is a colocation grade product, not a retail subscription.
What you actually need to begin. A charting platform that renders volume footprint and volume profile, an instrument with honest data, and the discipline to sit with it every session.
You do not need the most expensive stack on the internet. I have made a living reading structure with far less. What you need is the correct reading of what is in front of you.
NIC Pro is the flagship mentorship of Kumar Singh Global Trading Academy, delivered as private one to one live mentorship and as group mentorship. It is built on the No Indicator Concepts philosophy. Pure structure, real markets, zero indicators.
24 proprietary modules across six phases, taught live, not as a recorded product.
Phase five is dedicated to advanced execution models, because reading a chart and executing on it are two separate skills.
Virgin Zone Footprint and Virgin Zone Candle were added as the proprietary twenty fifth module after repeated requests from existing mentorship students.
Peak Row Method (PRM). A footprint based execution framework built around the dominant volume row.
Rejection Zone Flip Break (RZF). A model for handling levels that fail and then invert their role.
Fixed Range Volume Profile Range Execution Model (FRVP). Execution logic anchored to a defined range profile rather than a floating one.
Anchor Body Reclaim (ABR). A structural reclaim model built on candle body behavior at an anchored reference.
Virgin Zone Footprint (VZF) and Virgin Zone Candle (VZC). Zone identification and entry logic, carrying proprietary order flow conditions, taught with a confidential watermarked method book.
The execution models sit on top of nine original concepts developed over years of independent research.
Engulf Cycle Strategy
Mother Candle Logic
Volume Candle
Ascending and Descending Market Structure
Institutional Order Flow and Volume Footprint 1-2-3 Formula
Parallel Channel Structural Forecasting
Periodic Volume Profile Research
Institutional Fair Value Gap Framework
L1 to L3 Candle Body and Wick Psychology
The exact conditions of the 1-2-3 Formula and the entry, exit and risk rules of every execution model are never published. They are taught verbally in live sessions to enrolled mentorship students only.
The people reading these charts with me every day are not only Indian traders. They sit in the United States, the United Kingdom, across Europe, in Africa, across Asia and in Australia. They trade global assets in their own sessions and time zones.
I mention this for one reason. When someone tells you order flow does not work outside a niche, they are describing the limits of their own study, not the limits of the market.
Learn to read a naked candle first. Body, wick, sequence. If you cannot describe a chart without tools, footprint will only give you more things to misread.
Pick one instrument and stay with it for at least a full quarter. Footprint reading is instrument specific. Tick size, typical volume per row and normal imbalance behavior differ everywhere.
Learn the data your feed is giving you. Know whether your delta is measured or estimated before you build rules on it.
Read distribution before delta. Where did volume concentrate, and is that level structurally interesting.
Add volume profile for range context, then fair value gaps for imbalance context. Structure before signal, always.
Only then attach execution. Entry, stop loss and target are the last decision, not the first.
If you do not understand how a footprint chart is constructed, say that. It is an honest position and nobody will think less of you for it.
If you do understand it, then explain the classification issue properly to your clients instead of hiding behind the word approximation. Tell them which number is estimated and which number is measured. That is what a professional does.
What is not acceptable is telling an entire retail market that a tool used by institutions worldwide is a fantasy, purely because your own data product cannot support it. That is not investor protection. That is marketing.
If you are willing to learn, I am willing to teach. That offer has been open since I started mentoring and it stays open.
Kumar Singh Global Trading Academy (OPC) Private Limited was incorporated in January 2026 after years of independent trading and private mentorship. The academy teaches a zero indicator approach to institutional order flow, volume footprint, volume profile and structural price action, through live mentorship rather than recorded courses.
Brand promise: Pure Structure. Real Markets. Zero Indicators.
Kumar Ravishanker Singh, professionally known as Kumar Singh. Independent trader, trading mentor, entrepreneur and independent technical researcher. Reading markets independently since 1994, on a zero indicator philosophy. Based in Bihar, India, mentoring students across five continents.
NIC Pro Institutional Order Flow and Volume Footprint, private one to one live mentorship
NIC Pro group mentorship
NIC Fundamentals
NIC Self paced course
Trading Library and Pro Desk
Kumar Singh Global Trading Academy (OPC) Private Limited
CIN: U85490BR2026OPC081312
GSTIN: 10AAMCK4759P1ZY
Registered office: C/o Laxman Singh, Harpur, Tola-Bhumihara, Baniapur, Nagdiha, Saran, Bihar 841403, India
Website: kumarsingh.live
Email: ksingh@kumarsingh.live
Phone: +91 9999866089
NIC, NIC Pro, Kumar Singh and Kumar Singh Global Trading Academy marks are filed with the Trade Marks Registry under Class 41. All proprietary methods, method books and execution models are confidential and licensed to enrolled students only.
Kumar Singh Global Trading Academy (OPC) Private Limited and Kumar Ravishanker Singh are NOT registered with the Securities and Exchange Board of India (SEBI) or with any financial regulatory authority anywhere in the world.
This article and all associated content are provided strictly for educational and informational purposes. Nothing here constitutes investment advice, a recommendation to buy or sell any security, derivative, commodity or digital asset, a solicitation, or a promise of any outcome.
Trading and investing carry substantial risk of loss, including the possible loss of your entire capital. Derivatives and leveraged instruments increase that risk. Past performance, whether of a market, a method, a mentor or a student, is not a guarantee or indicator of future results.
No profit, income or performance claim is made or implied by this content. Any student example referenced is an account of learning and chart reading, not a representation of typical or expected financial results.
Third party platform features, plan tiers, pricing and exchange data specifications mentioned in this article can change at any time. Verify them directly with the relevant platform or exchange before making decisions. Readers are responsible for complying with the laws and regulations of their own jurisdiction, and should consult a licensed financial professional before acting on any market information.
Copyright Kumar Singh Global Trading Academy (OPC) Private Limited. All rights reserved. This article may be cited with attribution and a link to kumarsingh.live. It may not be reproduced in full without written permission.
The six questions traders actually search for on order flow, footprint data and Indian market data quality.
Part of it is estimated. Most of it is measured. The volume traded at each price row, the total volume of the bar, the point of control inside the bar and the shape of the distribution are measured values. They come from actual transactions. What is estimated on Indian retail feeds is the split between buy side and sell side within a row, and therefore delta, because the standard retail feed does not stamp which side was the aggressor on each trade. Software reconstructs it using classification logic. So footprint on Indian instruments is not fake. It has one derived component that is inferred, and a trader who knows which component that is can weight it accordingly.