We Teach Trading — Zero Tips, Zero Advice, Zero Recommendations. Not registered with SEBI or any financial regulator worldwide.
We Teach Trading — Zero Tips, Zero Advice, Zero Recommendations. Not registered with SEBI or any financial regulator worldwide.
Reading the Money, Not the Indicators: Indicators are built from price that already happened. The footprint shows you the buying and selling as it lands. Here is what that means for an options trader on Nifty and Bank Nifty.
A normal candle tells you four things. Open, high, low, close. That is it. Where price went, not who pushed it there.
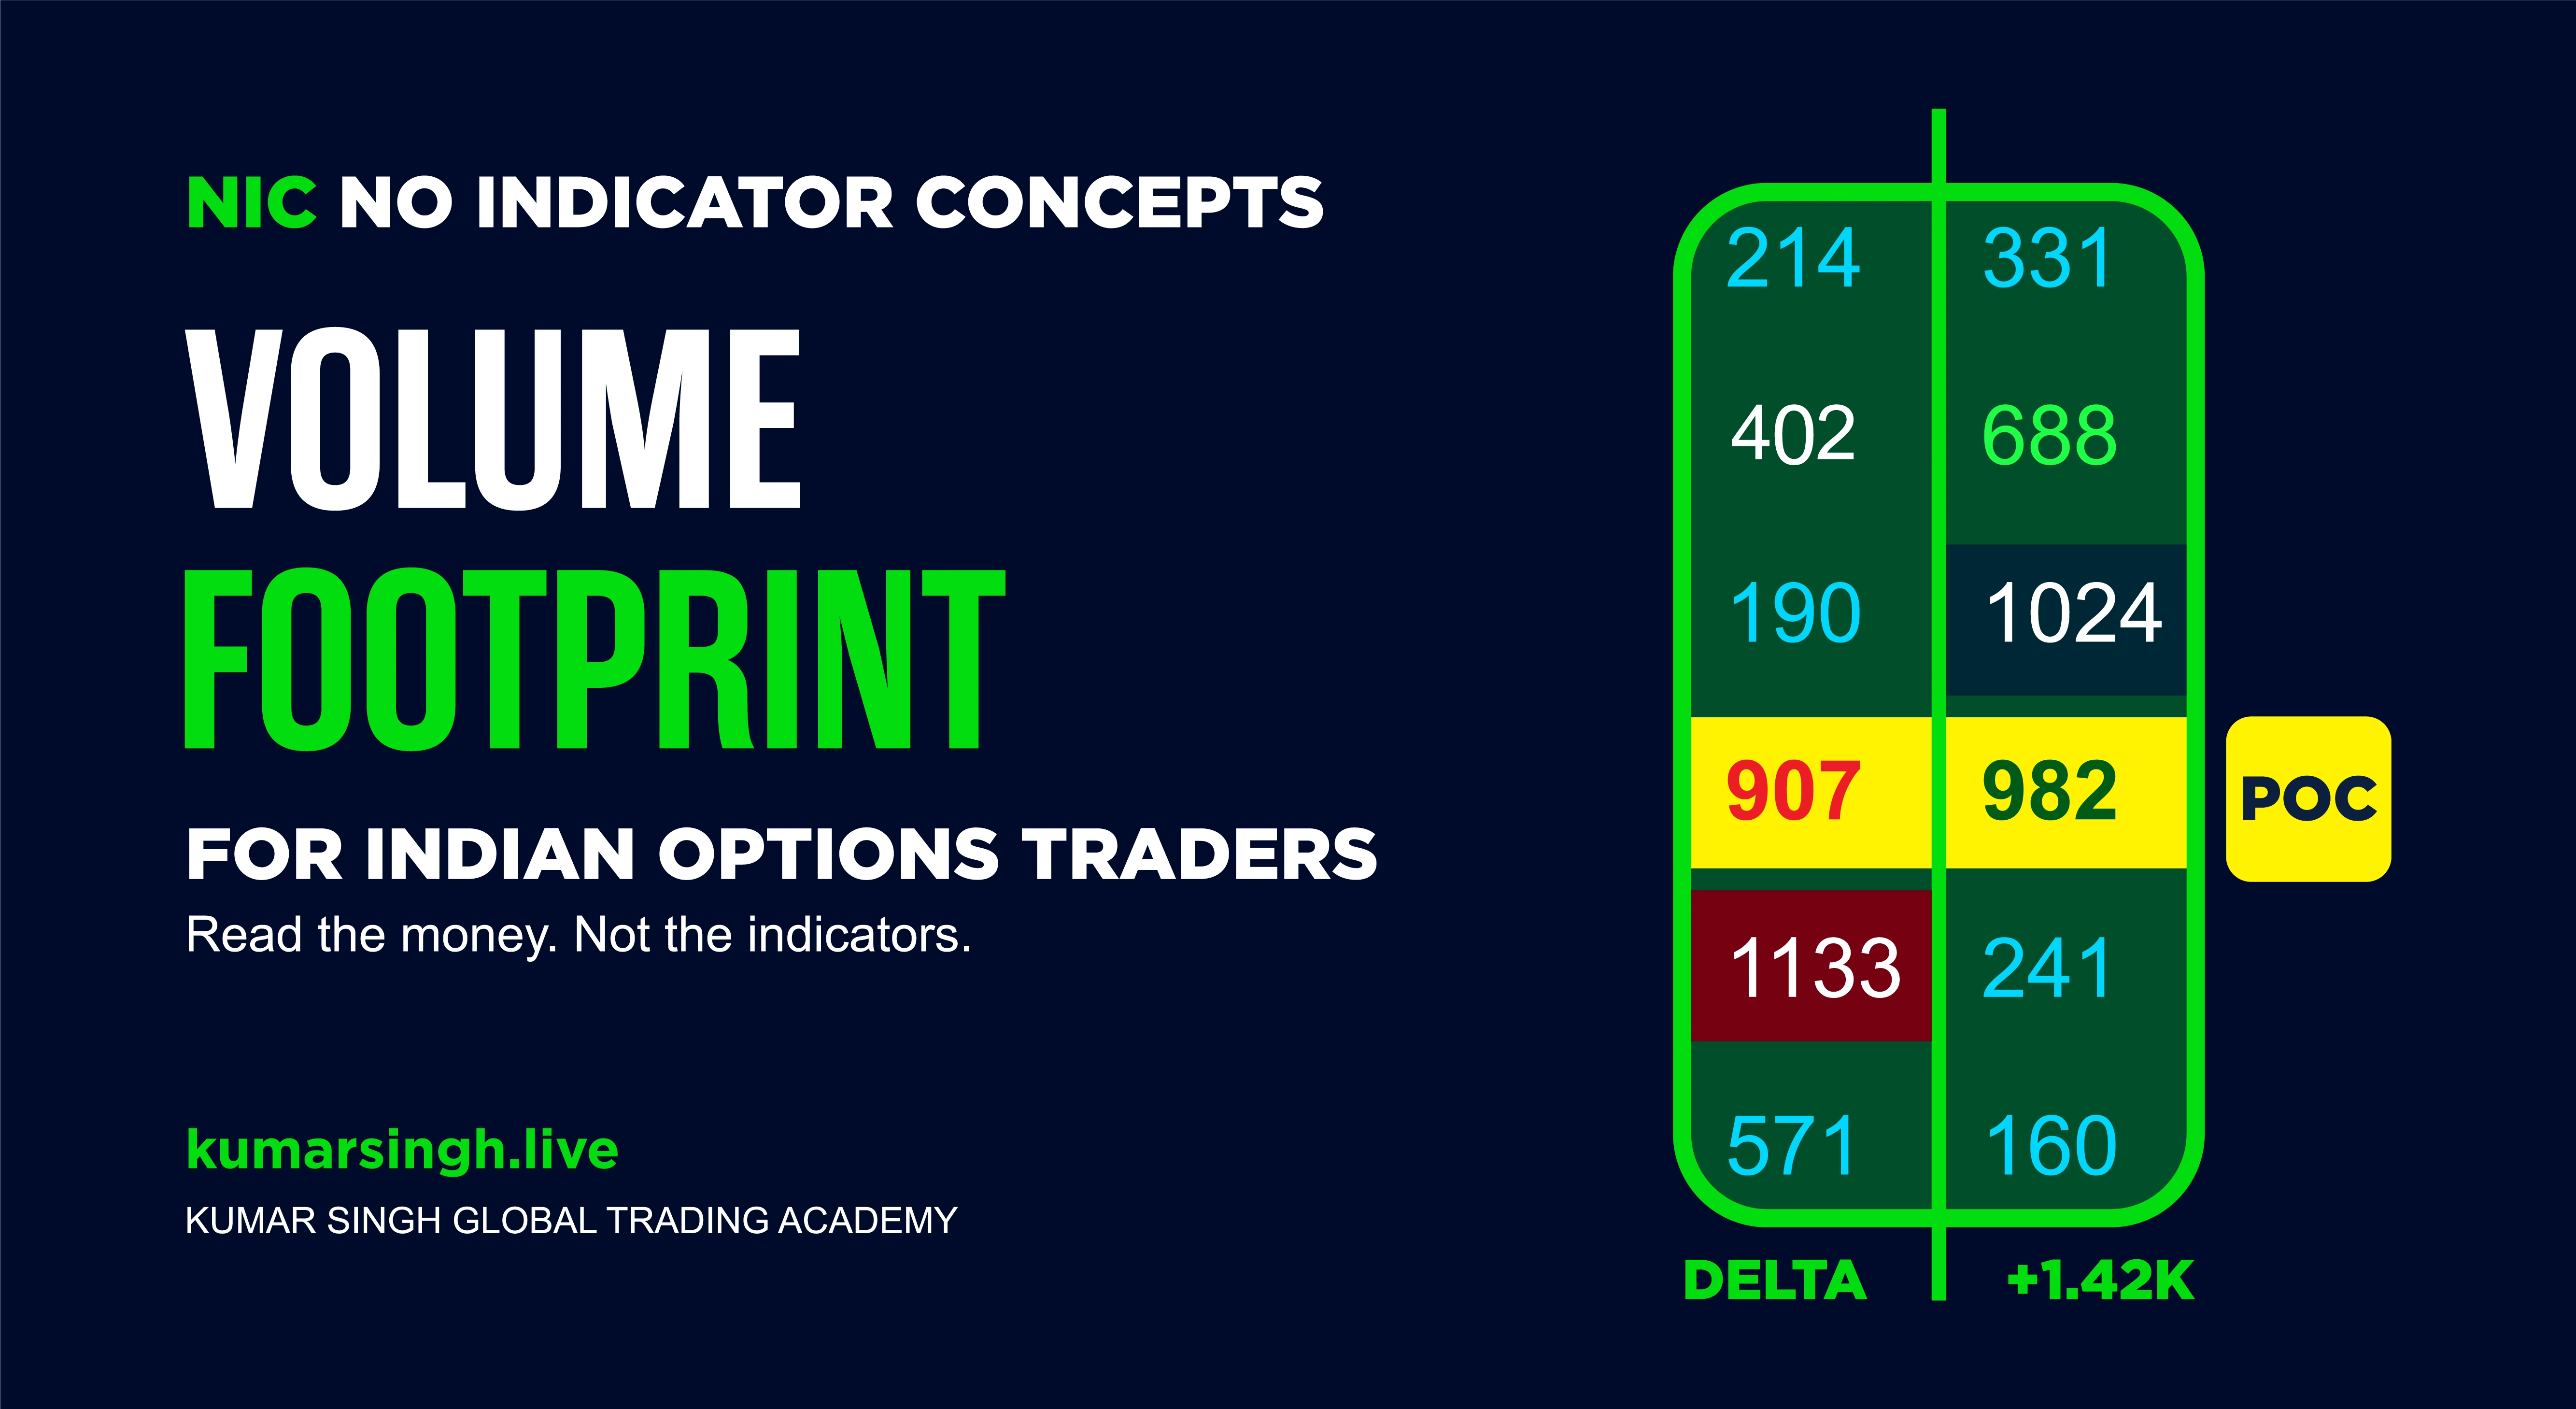
A volume footprint goes inside the candle. It shows you how much volume traded at every single price level, and it splits that volume into two sides. The buying that hit the ask. The selling that hit the bid. So instead of one green candle, you are looking at a column of numbers that tells you where the aggression actually happened.
From that, three things become readable. The delta, which is the difference between buying and selling pressure at each level. The point of control, the price where the most volume changed hands. And the imbalances, the spots where one side completely overwhelmed the other.
This is raw market data. No setting to tweak. No lag. Just what traded, and on which side.
Here is the part most people get wrong from day one. They try to read footprint on the option contract itself. The 24500 call. The 51000 put. And the chart looks like static. Thin volume, gaps everywhere, numbers that mean nothing.
That is not a footprint problem. That is a liquidity problem. Option volume is scattered across dozens of strikes and multiple expiries, so no single contract gives you a clean read of order flow.
The fix is simple once you see it. You read the footprint on the underlying. Nifty futures. Bank Nifty futures. The index is where the real money concentrates, and that flow is what drags your option premium up or down in the first place.
So the footprint becomes your read on the underlying. The option becomes your instrument. You are watching where the institutions are committing on the future, then using that to time the strike. For a weekly expiry trader sitting on Bank Nifty, that distinction is the whole game.
Once you are looking at the right chart, a few things start to matter.
Delta on its own is noise. Everyone stares at the delta number and thinks it is a buy or sell signal. It is not. What matters is the relationship. Delta against price. Delta against the level. When buying is heavy but price refuses to go anywhere, something is absorbing it. When price runs but the volume behind it is thin, the move is hollow.
Point of control matters because it tells you where the market agreed on value. Watch how it moves session to session and you are watching the battle shift.
Imbalances matter because they show you where one side gave up. A stack of them in one zone is the market leaving a fingerprint.
I will be honest about what I am not putting in this article. The exact conditions I use to read these together, the way I structure an entry off them, the calibration that makes the chart actually usable, none of that goes in a blog post. That is the part I teach live, one to one, because it is the part that took years to build and it is not something you learn from a paragraph. What you can take from here is the concept. The judgment is taught.
Three mistakes, over and over.
They read the option contract instead of the underlying, and then they blame the tool when the chart looks like garbage.
They treat delta as a signal in isolation. Big green delta, they buy. Big red delta, they sell. The market eats that for breakfast, because absorption looks exactly like strength until the reversal hits.
They run the chart with whatever default settings the platform shipped with. A footprint that is not calibrated to the instrument you are trading shows you the wrong story at the wrong resolution. The setup matters as much as the read, and most people never touch it.
None of these are intelligence problems. They are training problems. Nobody showed them how the chart is supposed to be set up or how the readings connect. So they conclude footprint does not work, when the truth is they were never taught to use it.
NIC stands for No Indicator Concepts. The whole method is built on reading what the market is actually doing, not what a lagging line drawn from old price tells you it might do. Volume footprint sits at the center of that.
Inside the NIC Pro program, I teach how to set the chart up for Indian index futures, how to read order flow on the underlying to time your options, and how the individual readings combine into something you can actually act on. Live. One to one or in a small group, never as a recorded file, because order flow is a skill you build with feedback, not a video you watch once.
If you want to see how I trade it, I run a free private session most weeks for traders who are serious about learning this properly. New to charts, or reading order flow already? There's a program for your level.
This is education on a skill and a method of market analysis. It is not advice to trade, and it makes no claim about returns.
You can, but you usually should not. Option liquidity is split across many strikes and expiries, so a single contract rarely gives a clean read. Most order flow traders read the footprint on the underlying future, Nifty or Bank Nifty, and use that to time their option entries.
No. That is the entire point of the NIC approach. A footprint is raw order flow, the actual buying and selling at each price. Indicators are derived from price that already happened. If you are reading the flow directly, you are reading ahead of what an indicator would eventually show you.
You need a tick by tick data feed, not standard candle data, and a charting platform that supports footprint or order flow view. The feed is the non negotiable part. Without true tick data the footprint cannot be built accurately, and a half accurate footprint is worse than none.
The concepts are here. The application is taught live. I cover the full footprint and order flow method inside NIC Pro, one to one or in a small group, with the chart setup and the readings walked through on real markets. Start at kumarsingh.live and join a free session.