We Teach Trading — Zero Tips, Zero Advice, Zero Recommendations. Not registered with SEBI or any financial regulator worldwide.
We Teach Trading — Zero Tips, Zero Advice, Zero Recommendations. Not registered with SEBI or any financial regulator worldwide.
Most traders study price. Almost nobody studies where the money actually changed hands. Volume Profile closes that gap. It shows the exact prices where buyers and sellers did the most business, and the single price where they did the most of it. The Point of Control. Read it alongside order flow and the volume footprint, and the chart stops looking random. This is a structural concept, taught with zero indicators.
Open any chart. You see candles. Time across the bottom, price up the side.
What you do not see is where the real business happened. Which price buyers and sellers fought over the most. Which level kept pulling price back like it owed somebody money. Your candlestick chart cannot show you that. It was never built to.
So you keep getting stopped out at levels that feel random. They are not random. Price was returning to a reference. A price the market had already accepted as fair. You just had no way to see it.
Volume Profile gives you that view. It takes the same data sitting on your screen and asks a sharper question. Not "what time did this happen." Instead, "at what price did the volume actually stack up."
That single shift changes how you read the entire chart.
A normal volume bar sits at the bottom of your screen. It tells you how much traded during a slice of time. Useful, but shallow.
Volume Profile turns that idea on its side. It plots volume by price instead of by time. The result is a horizontal histogram running down your chart. Long bars where heavy volume traded. Short bars where almost nothing did.
Now you can see the shape of participation. Where the market spent real time and size. Where it ripped through fast and barely traded at all.
This is raw market behavior drawn as structure. Not a lagging calculation laid on top of price. That difference is the whole foundation of the No Indicator Concepts approach at Kumar Singh Global Trading Academy. You read what the market actually did with volume. You do not read what a formula guesses it might do next.
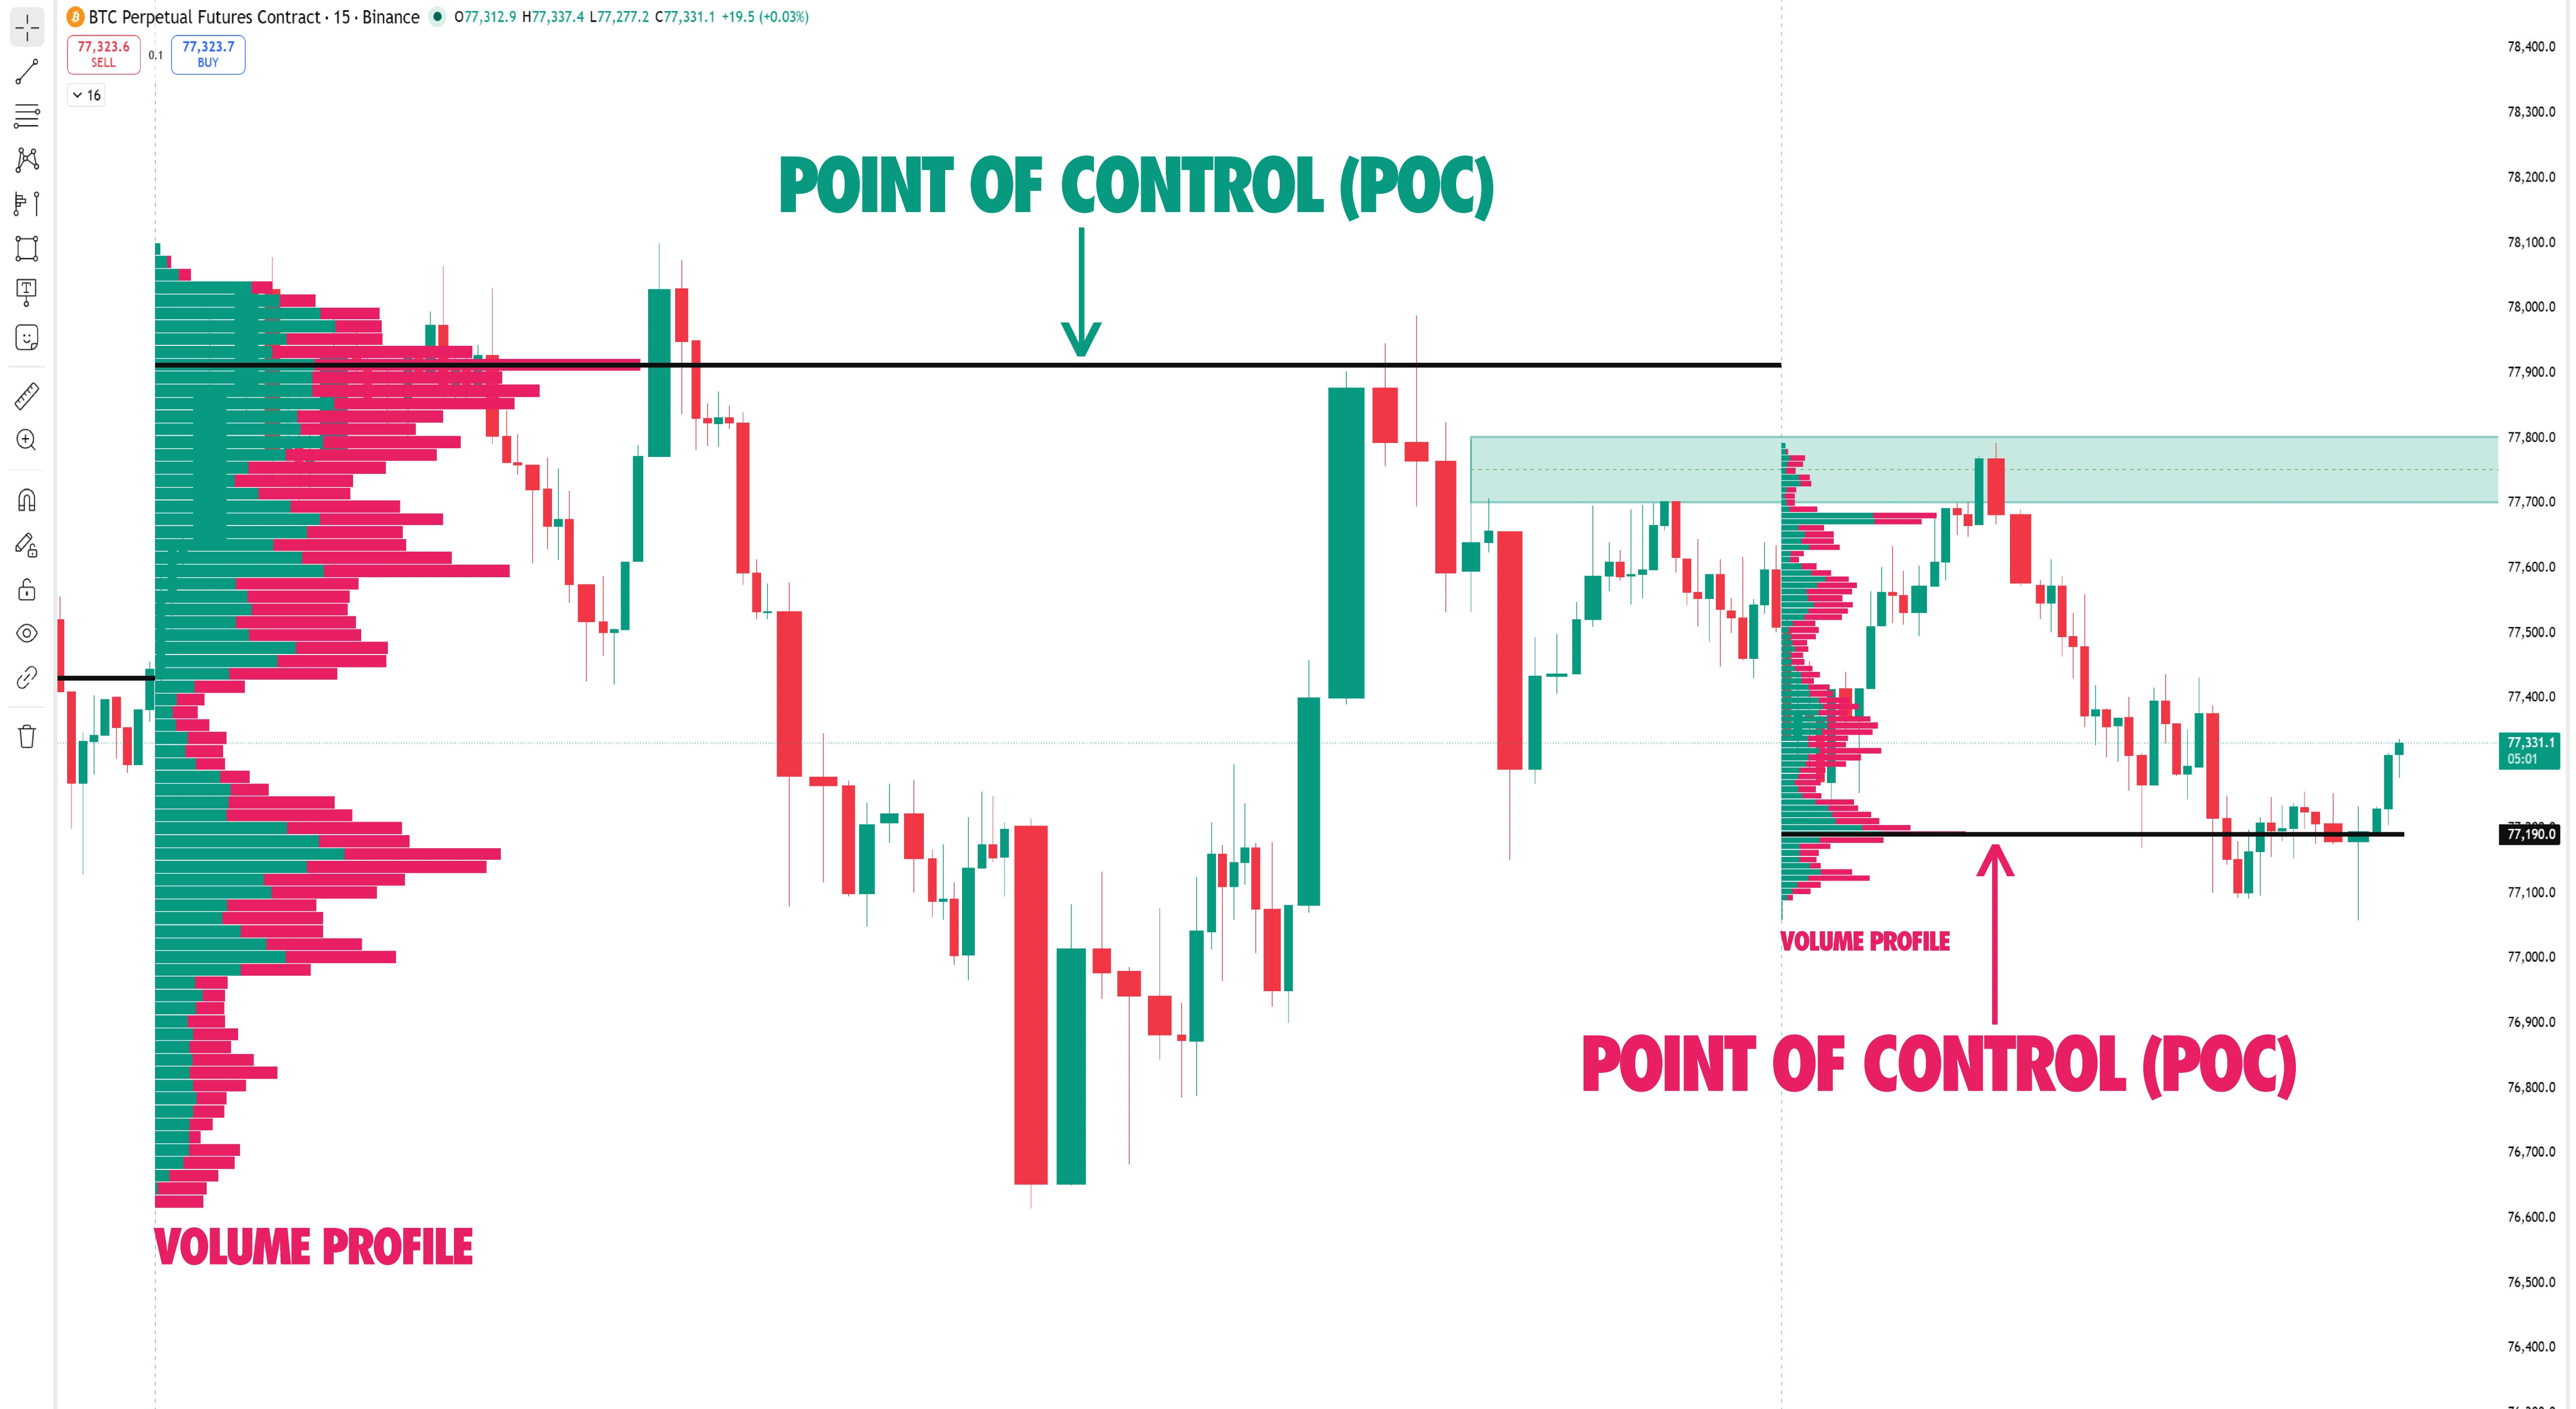
Look at the longest bar in the profile. That is the Point of Control. The POC.
It marks the single price level where the most volume traded across the period you are studying. The price where buyers and sellers transacted the heaviest. In plain terms, the price the market treated as fair.
Why traders watch it is simple. Size leaves a footprint. When a large amount of business gets done at one price, that price becomes a reference. The market remembers it. Price often drifts back toward it, tests it, reacts around it.
The POC is a structural concept, not a trade signal. It does not tell you to buy or sell. It tells you where the heavy participation sat, so you can study what price does when it returns there. The reading is the skill. The level is just the map.
Around the POC sits a zone called the Value Area. It captures roughly seventy percent of all the volume in that profile.
Two edges define it. The Value Area High at the top. The Value Area Low at the bottom.
This zone shows where the market considered price fair and acceptable. Inside the value area, the market is in balance. Buyers and sellers agree. Outside it, something shifted. Price is exploring, getting rejected, or trying to build a new area of agreement somewhere else.
Reading whether price sits inside or outside value, and how it behaves at those edges, is one of the cleanest ways to understand market context. No oscillator required.
Not every bar in the profile carries the same weight. Two shapes matter most.
A High Volume Node is a fat cluster of bars. Heavy trade. Acceptance. The market spent serious time and size here. These zones slow price down. They act like thick mud. Price grinds through them, congests, often pauses.
A Low Volume Node is the opposite. Thin bars. Almost no trade. Rejection. The market wanted nothing to do with this price and moved through it fast. These zones behave like air pockets. When price enters one, it can travel quickly because there is little participation holding it in place.
Acceptance and rejection. Mud and air. Once you start seeing the profile this way, the chart stops looking flat and starts showing structure with depth.
This matters, because the academy is built on No Indicator Concepts, and people ask the question fairly.
A traditional indicator takes price, runs it through a formula, and prints a smoothed line that always arrives late. It is a guess about price, derived from price.
Volume Profile is different in kind. It is a picture of actual traded volume at every price. Raw participation. Nothing calculated, nothing smoothed, nothing lagging behind. You are looking at what the market did, plotted where it did it.
That is why it belongs at the center of an order flow approach. It reads the market on its own terms.
Here is where it gets serious. Volume Profile alone tells you where size sat in the past. Order flow tells you what size is doing right now at that price.
Put them together and the level comes alive.
When price returns to a POC or a value area edge, the profile says "heavy business happened here before." The volume footprint then shows you the live reaction. Are buyers absorbing? Are sellers stepping away? Is delta flipping at the exact price the profile flagged? The footprint reads bid and ask activity inside the candle, so you watch acceptance or rejection form in real time, right at the reference level the profile gave you.
This is the core of institutional order flow and volume footprint reading. The profile sets the map. The footprint reads the moment. One without the other leaves you half blind.
That combination, profile plus footprint plus delta, is exactly what gets taught and drilled inside the NIC programs at Kumar Singh Global Trading Academy.
A single static line is only the start. In real markets, the POC moves and layers.
A developing POC shifts during the session as fresh volume builds. Watching it migrates up or down tells you which side is doing the heavy lifting in real time.
A naked POC, sometimes called a virgin POC, is a Point of Control from a previous period that price has not yet returned to test. Untested reference levels often draw attention, because the market has unfinished business there.
A composite profile stacks many sessions into one view to reveal the bigger reference structure beneath the noise. A single-session profile zooms in on the day.
Same tool. Different lenses. Knowing which lens to pull up, and when, is where reading turns into a real skill.
Standard Volume Profile is the foundation. Every serious volume reader has to begin there.
The deeper layer is Periodic Volume Profile. This is the proprietary research framework developed and taught only inside the flagship NIC Pro programme at Kumar Singh Global Trading Academy. It studies how volume distributes across structured periods to read institutional reference behaviour with far more precision than a basic profile allows.
The full framework stays with enrolled NIC Pro students and is never broken out or sold on its own. What matters for you here is the principle. Volume Profile and POC are step one. There is a structured, repeatable way to read them at depth, and it is built on raw volume and order flow. Never indicators.
Three errors show up again and again.
The first is treating the POC like a buy or sell button. It is a reference level, not a signal. Trading it blind, with no context, is just guessing at a prettier line.
The second is reading the profile in isolation. Volume Profile earns its power when you pair it with order flow. The profile shows where size sat. The footprint and delta show what size is doing at that price right now. Use one without the other and you only see half the picture.
The third is ignoring the period. A POC from a one-hour profile and a POC from a three-month composite are not the same animal. Traders mix timeframes, confuse themselves, then blame the tool.
Skip these three and you are already reading the profile better than most.
Volume Profile, POC, and the value area are not standalone tricks. They are one part of reading institutional order flow and volume footprint, which is the spine of everything taught at Kumar Singh Global Trading Academy.
The market does not move on indicators. It moves on money. Volume Profile is one of the clearest windows into where that money sat. Combined with footprint reading, delta, and structural concepts, it gives you a way to read the chart that does not lean on a single moving average or stochastic anywhere on your screen.
This is a skill. Built through structure, repetition, and live reading. Markets carry risk, and no level or framework removes that. What changes is your ability to read what the market is actually doing.
Want to learn to read these levels properly, with order flow and footprint context instead of copied lines? That is exactly what the mentorship at Kumar Singh Global Trading Academy is built to teach. Live sessions. Real markets. Zero indicators.
There is also a free private weekly session for traders thinking about the program. Reach out on WhatsApp or YouTube to find your seat.
Secure My Seat in The Mentorship
This content is for educational purposes only. It explains market concepts and the skill of reading structure. It is not investment advice, a recommendation, or a guarantee of any result. Trading and investing carry risk, including loss of capital. Past behavior of any level or market does not promise future behavior. Make your own decisions or consult a registered professional.
The Point of Control, or POC, is the price level where the most volume traded over a chosen period. It marks where the market did the heaviest business, which is why traders treat it as a structural reference level rather than a trade signal.
No. An indicator is a formula applied to price that prints a lagging line. Volume Profile is a picture of actual traded volume at each price. It shows raw participation, which is why it fits a no-indicator approach.
VWAP is a volume-weighted average price across a session. The POC is the single price with the most traded volume in a profile. They answer different questions, and reading them together adds context.
It is a Point of Control from an earlier period that price has not yet returned to test. Untested reference levels often attract attention because the market has unfinished business there.
The profile gives you the reference level. Order flow and the volume footprint then show the live reaction at that level, so you can read acceptance or rejection as it forms instead of guessing.