We Teach Trading — Zero Tips, Zero Advice, Zero Recommendations. Not registered with SEBI or any financial regulator worldwide.
We Teach Trading — Zero Tips, Zero Advice, Zero Recommendations. Not registered with SEBI or any financial regulator worldwide.
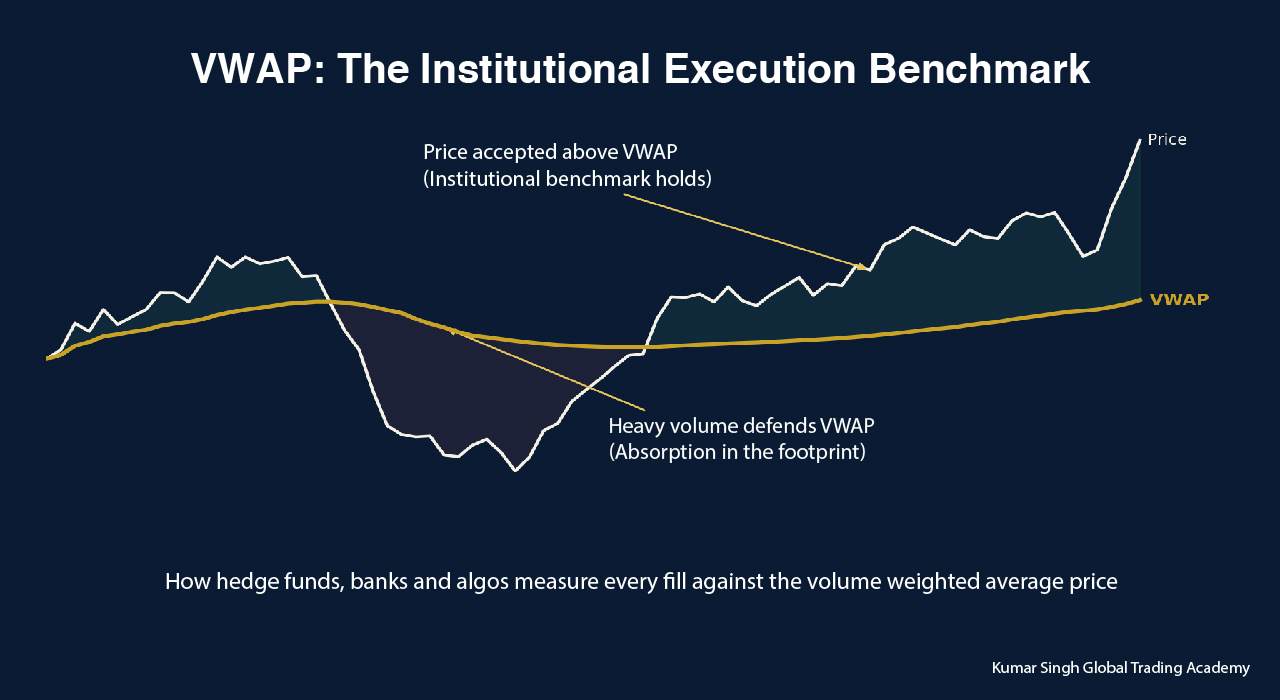
VWAP is one of the few tools that retail traders, hedge funds, large banks and execution algorithms all look at every single session. This guide explains what VWAP actually is, why institutions execute billions against it, and how an order flow and volume footprint trader reads it correctly. Written by Kumar Ravishanker Singh, professionally known as Kumar Singh, reading markets since 1994.
I teach zero indicators. My entire NIC framework, No Indicator Concepts, is built on pure market structure, order flow and volume footprint. So why am I writing about VWAP?
Because VWAP does not belong in the same bucket as RSI, MACD or moving average crossovers. Those are derivatives of price drawn for retail decision making. VWAP is different. VWAP is the price institutions are judged against. It exists because of how large money must execute, not because someone wanted another line on a chart. Once you understand that, VWAP stops being a signal and becomes something far more useful. It becomes location. And location is where order flow reading begins.
VWAP stands for Volume Weighted Average Price. The math is simple and honest.
Take each trade or each bar in the session.
Multiply price by the volume traded at that price.
Add it all up and divide by total volume traded so far.
The result is the true average price at which the market transacted today, weighted by how much actually traded at each level. A tick that traded 50 lots counts more than a tick that traded 2 lots. VWAP resets at the start of every session, which is exactly why it matters for that session and loses meaning if you stretch it blindly across days without anchoring it properly.
Here is the part most retail content gets wrong. Institutions do not look at VWAP and think buy above, sell below. They use it to answer one question. Did we execute well?
A fund that bought a large position below the day VWAP paid less than the average participant. Good execution.
A fund that bought above VWAP paid more than the crowd. The execution desk will be asked why.
VWAP is the report card of the execution desk. That single fact explains everything else about why it still dominates institutional trading decades after it was introduced.
Four practical reasons, and none of them are about prediction.
Best execution obligations. Regulated institutions across the world must demonstrate that client orders were executed fairly. VWAP is the most widely accepted neutral benchmark for that proof.
Transaction cost analysis. Every serious desk runs TCA reports. Slippage is measured as the difference between average fill price and VWAP. Traders and brokers are ranked on it.
Market impact control. A large order dumped at once moves price against the buyer. Spreading execution across the session and tracking it against VWAP keeps impact low and measurable.
Client reporting. When a pension fund gives a bank a large order, the bank often commits to deliver fills at or near VWAP. It is a contract level benchmark, not a chart decoration.
Walk into any institutional order management system and you will find a VWAP algo sitting next to TWAP and POV. The logic is worth understanding even if you never use one.
A VWAP algo takes a large parent order and slices it into small child orders.
It distributes those slices according to the expected volume curve of the day. Markets typically trade heavy near the open, quiet at midday, heavy again near the close. The algo mirrors that curve.
The goal is to finish the order with an average price as close to the session VWAP as possible, leaving minimal footprint.
This is also why VWAP behaves like a magnet on many sessions. Thousands of institutional child orders are programmed to participate around it. When you see price return to VWAP and heavy volume appear, you are often watching scheduled institutional participation, not random noise.
This is where my world and VWAP meet. The footprint shows what actually happened at a price. VWAP tells you which price mattered to the biggest participants. Combine the two and the chart starts speaking.
When price pulls back to VWAP and the footprint prints unusually heavy volume without price breaking through, that is absorption at the benchmark. Someone large is active exactly where large players are measured.
When price trades above VWAP and keeps getting accepted there bar after bar, the average buyer of the day is comfortable. Value has migrated.
When VWAP and the session Point of Control sit close together, you are looking at a level where both average price and maximum traded volume agree. In my NIC Pro sessions we treat that confluence with full attention.
Notice what I did not say. I did not say buy at VWAP or sell at VWAP. VWAP gives you the location. The footprint gives you the behaviour at that location. The decision framework is a separate skill, and it is exactly what I teach live.
Real example from how I explain it in sessions. A large cap stock announces results before the open. The stock opens higher on heavy volume. Through the morning, every dip finds volume near the rising VWAP and the footprint shows buyers absorbing supply there. That pattern told an observant trader one thing. The average participant who transacted that day was defending their average price. No indicator crossover required. Just an honest reading of where the day’s business was done.
Index futures traders in India live and die by session context. VWAP adds a clean layer to it.
On trending sessions, index futures often spend the entire day on one side of VWAP. Repeated failed attempts to reclaim it show you which side controlled the auction.
Options traders benefit indirectly. Premium behaviour often shifts when the underlying future transitions from rejecting VWAP to accepting it, because the character of the session itself has changed.
One observational example. On a monthly expiry session, the index future rejected VWAP three times in the first two hours, each rejection printing selling imbalances in the footprint. The session character was defined by that behaviour long before any indicator based trader noticed a trend.
Commodities like crude oil and gold trade on global flows, and Indian evening sessions inherit volume from international markets. VWAP handles this beautifully because it is volume weighted by definition. When US participation enters in the evening and volume expands, VWAP automatically gives those hours their true weight. A commodity trader who watched gold hold above a flattening VWAP through the illiquid afternoon and then accelerate away from it on evening volume was watching value confirmation in real time.
Crypto never closes, so the daily reset logic of VWAP needs one adjustment. Anchoring.
Anchor VWAP to the daily open at 00:00 UTC, or to the weekly open, or to a major event candle.
From that anchor, VWAP shows the average price of every participant since that moment.
Example. After a sharp overnight move in Bitcoin, price retraced during Asian hours and stabilised exactly around the VWAP anchored from the move’s origin, with the footprint showing two sided heavy volume. That told observers where the post event auction found balance. In a 24x7 market with no official close, that kind of volume weighted reference is one of the few honest anchors available.
Spot forex is decentralised, so true volume is fragmented. Be honest about this limitation. Two clean solutions exist.
Use currency futures, where volume is centralised and real. USDINR futures on Indian exchanges print genuine volume, and VWAP there is fully meaningful.
On spot platforms, tick volume is a proxy. Imperfect, but studies have long shown tick volume correlates strongly with real activity in major pairs.
A currency futures trader watching USDINR hold one side of VWAP through the RBI reference rate window was reading session control the same way an index futures trader does. Same logic, different instrument.
Treating every VWAP touch as an automatic entry. VWAP is location, not permission.
Using VWAP on illiquid stocks where a handful of trades distort the average.
Ignoring session context. VWAP behaviour on a trend day and a balance day are two different languages.
Stacking VWAP with five other indicators until the chart argues with itself. The whole point of VWAP is that it reflects actual transacted business. Bury it under derivatives and you lose that.
Carrying intraday VWAP conclusions into positional decisions without re anchoring.
In my NIC Pro sessions, VWAP is never a signal line. It is one of the locations where we open the volume footprint and ask the only questions that matter. Who is trading here, how aggressively, and is price being accepted or rejected. The exact conditions I use to answer those questions are proprietary and taught verbally in live sessions only. That is deliberate. Conditions written publicly become conditions traded blindly, and blind trading is what I stand against.
If this article changed how you look at a single gold line on your chart, imagine what happens when you learn to read the full order flow behind every candle. In my mentorship at Kumar Singh Global Trading Academy (OPC) Private Limited, I teach the complete NIC No Indicator Concepts framework live.
Pure structure, real markets, zero indicators. Volume footprint, order flow, market structure and institutional behaviour, taught from thirty plus years of screen time since 1994.
Live sessions where conditions are explained verbally, on real charts, with real questions answered personally by me.
A framework that works across stocks, futures and options, commodities, crypto and currency markets, because auction logic does not change with the instrument.
Visit kumarsingh.live to explore NIC Pro and the Trading Library or reach out at ksingh@kumarsingh.live. I personally reply to every query.
This article is published for educational purposes only. Kumar Singh Global Trading Academy (OPC) Private Limited is not registered with SEBI or any financial regulatory authority worldwide. Nothing here is investment advice, a recommendation, or a call to buy or sell any security, derivative, commodity, currency or digital asset. All examples are observational illustrations of past market behaviour. Trading involves substantial risk of loss. Consult a registered investment adviser before making any financial decision.