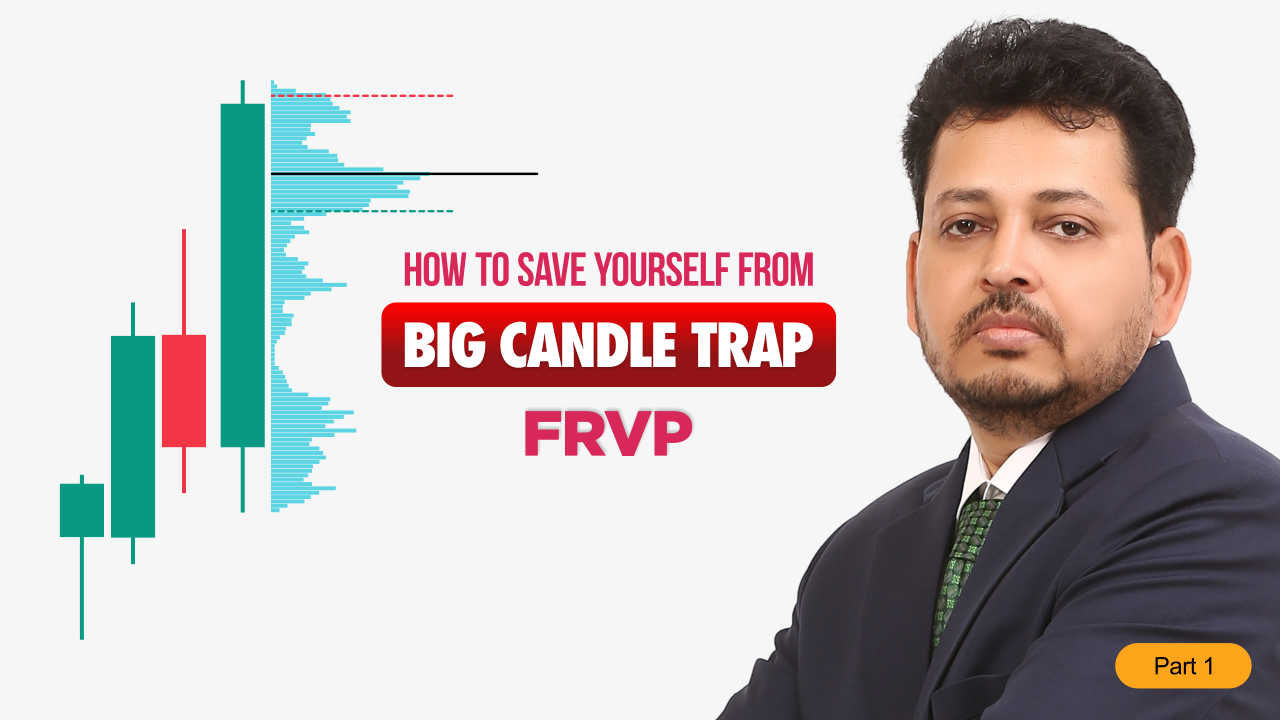
Why do big breakout candles trap traders, and how do you avoid entering at the worst price on the chart? In this Trading Library session, Kumar Singh explains the big candle trap using the Fixed Range Volume Profile (FRVP) tool. You will learn what a large breakout candle actually does to the order book, why the inside of a big candle behaves like a low volume vacuum, why sharp pullbacks follow oversized breakout bars, and how FRVP reveals acceptance versus rejection before you commit to a trade. This is pure market structure and order flow logic. No indicators, no noise.
Part of the Trading Library at Kumar Singh Global Trading Academy. Reading Markets Since 1994.
Disclaimer: This content is for educational purposes only. Not registered with SEBI or any financial regulatory authority worldwide.
#VolumeProfile #PriceAction #OrderFlowTrading
Transcript
(0:05) Hi everyone, this is Kumar Singh and welcome to Kumar Singh Global Trading Academy. (0:11) In today's video, we will talk about Deep Candle Trap. (0:14) Deep Candle Trap means whenever there is a large Candle form in the market, (0:20) whether you trade future options in Nifty, Bank Nifty, Sensex, (0:26) or you trade cryptocurrency in Bitcoin, Solana, Ethereum, (0:29) or you trade in gold in Fultz, or you trade in any currency pair, (0:36) or you trade in any stock or intraday, (0:41) you can trade in any way you want.
(0:44) All the retailers worldwide, (0:47) maximum people in the market, (0:49) big bar and the smallest possible ejection bar is the smallest ejection Candle (0:57) and the largest is the largest Candle. (1:00) There is a lot of trap in these two places. (1:03) And usually, the FOMO entry of the maximum retailers is on the big bar.
(1:10) For example, this is your volume footprint chart. (1:12) We are not talking about this right now. (1:14) Usually, I put a volume Candle here.
(1:17) And this is the Bitcoin chart. (1:20) I have put the Bitcoin chart here at a time of 15 minutes. (1:22) If I look at this Bitcoin chart in the past, (1:27) there is a downfall here.
(1:29) When this market has come down from the top, (1:32) there is a very good bearish downfall. (1:36) Before coming here, the market has created a very healthy green bullish Candle. (1:43) A lot of retailers will feel from this big bar (1:47) that the market is functioning higher and higher.
(1:50) For example, the market is functioning higher and higher. (1:56) They will think that the market is functioning higher and higher. (2:00) Again, the market is creating a high rate here.
(2:02) Then it will create a higher low again and the market will go up. (2:05) And whenever there is a big bar in this market, (2:09) whether it is the first Candle of the market (2:11) or somewhere in the range of the trending market, (2:14) whenever a retailer finds an entry on the big bar, (2:17) why does it happen that the market gets trapped? (2:21) And beyond its expectations, (2:23) if you look at the big bar and think that it is a healthy Candle (2:26) and the market will go up, (2:28) then as soon as you enter here, the market comes down and your ASL is cut. (2:34) The main reason for this is that you do not understand the theory of candlesticks.
(2:38) There is nothing in the market except price and volume. (2:41) At Kumar Singh Global Trading Academy, (2:43) we already provide Nick Pro 1-to-1 Volume Footprint and Auto Flow Metrics. (2:50) In addition to 1-to-1, we also provide Group Metrics.
(2:54) In all of them, we talk in detail about Volume Footprint and Auto Flow. (2:59) In addition to talking in detail, all the other topics that come under Auto Flow, (3:04) Auto Flow is a very broad subject. (3:06) Volume Footprint is a very deep learning curve.
(3:08) But if you combine all of them, (3:11) then the advantage of all of them is that (3:14) no matter what is the way of trading in the market, (3:17) you trade in any instrument in any way, (3:20) but everyone has the same way (3:21) that you have to make good money in the market by avoiding the fight between price and volume. (3:28) Before that, whatever indicator you use in the market, (3:32) whatever logic you use, (3:33) the first thing you have to do is to understand the story between the large, small, and canals in the market. (3:43) What is the reason behind them? (3:47) And all these canals that you are seeing, (3:49) how much buy and how much sell happened in all of them? (3:51) This means that in the market, (3:53) there is nothing except price and volume.
(3:56) All the indicators, strategies, and logic are made around them. (4:01) Our today's subject is how to avoid the big bar traps (4:06) and how to get stuck in the big bar trap (4:09) and make a loss in the FOMO entry (4:12) and to avoid that loss, we will talk about it. (4:15) First of all, let's understand why the big bar is made here.
(4:20) The big bar does not always mean that the market will always go up (4:24) or there is not much buying volume here. (4:27) There is not much buying volume and there is not much momentum here. (4:31) There is a very large volume gap here, (4:35) that is, there is a vacuum of liquidity.
(4:38) And when there is no participant in the market in the gap between the volume, (4:43) then at a particular price range where people are buying and selling, (4:48) for example, if I put a volume footprint chart here, (4:51) then while reading the volume footprint, we read about bid-ask options. (4:57) But if we are not using the volume footprint, (5:00) if we are only using the candlestick chart, (5:03) then we do not know how much volume is there in the candlestick chart. (5:08) To understand this, we have multiple tools.
(5:11) If we come to the indicators, (5:13) then you will find a lot of indicators of volume profiles in the technical profiles. (5:19) But there is one indicator here. (5:22) Fixed Range Volume Profile (5:23) You can go to the indicator and drag the Fixed Range Volume Profile from here.
(5:31) Or it would be best if you come to the bottom in the fifth row. (5:37) Fixed Range Volume Profile is given here. (5:41) Through this, you can better imagine any candle, any session, any entire month, (5:48) any entire year, any entire week, any hour, minute, whatever you can imagine.
(5:55) Whatever you can imagine, (5:57) in the zone of all those sessions, whether it is monthly, quarterly, weekly or yearly, (6:02) in the market, between the market makers and retailers, (6:08) the buy-sell, market order, limit order, pending order, (6:12) who is the heaviest in the market, (6:15) that is, who is buying the most in the market, (6:17) you can get information about this. (6:19) Plus, the lowest volume here, (6:22) you can get information about the lowest volume notes, (6:24) about the highest volume notes, (6:25) how they affect the market, (6:28) you can get information about them. (6:30) Fixed Range Volume Profile is a very interesting subject.
(6:32) In the coming weeks, (6:34) every single month, every single week, (6:36) I will try to upload new videos, (6:38) important videos that come under Order Flow and Volume Profile. (6:41) I upload them for you here at Kumar Singh Global Training Academy. (6:45) So stay tuned.
(6:46) Here is your big bar. (6:49) If I draw the Fixed Range Volume Profile tool from here, (6:53) then we get to see something very interesting here. (6:56) For example, if you are not able to see the color, (6:57) then I will double-click and hide the body.
(7:00) So here we get to see that this area, (7:04) you will see three lines in this area. (7:06) If it is not visible, then I will thicken it a little. (7:09) In style, here in VAH, (7:12) here I have made it large.
(7:14) VAH means Value Area High, (7:17) VAL means Value Area Low, (7:19) and POC means Point of Control. (7:22) Now, as I have thickened all three here, (7:24) now you can see here, (7:26) let me zoom in a little, (7:27) that in this area, in the market, (7:29) you have this zone. (7:31) In this zone, (7:32) compared to all these zones, (7:34) Volume Bar, (7:35) this row that you are seeing, (7:36) is called Volume Bar.
(7:38) This Volume Bar, (7:39) compared to all the other rows here, (7:42) is much larger. (7:44) This means that when this candle was made in the market, (7:48) and whatever candle market is being made, (7:50) red or green, (7:51) nothing happens. (7:52) There is a time container in the market.
(7:54) Time container, (7:55) because if the market wants to go down, (7:57) then it will go, (7:58) if it wants to go up, then it will go. (7:59) But we use different small and big time frames, (8:02) so in the same time, (8:03) in the market, (8:05) the price is progressing with the volume, (8:07) so in the market, (8:08) this is just a time container, (8:10) nothing else. (8:11) When there is a trade in the market, (8:12) it is zone to zone.
(8:14) It has no meaning in any time frame. (8:17) So if you trade in the Indian market, (8:19) in options, (8:20) or in crypto, (8:21) or in forex, (8:22) so till now, (8:23) so many people have given you the opportunity to trade in different time frames in the market, (8:27) so please stay away from that. (8:29) The market has no meaning in time frames.
(8:31) The market means zones, (8:32) and the market trades from zone to zone. (8:34) And that same zone, (8:35) this fixed range volume by tool is showing you. (8:39) Meaning here, (8:40) in this particular candle, (8:41) which is our big bar, (8:43) in this big bar, (8:44) there is a complete vacuum of volume here.
(8:46) Meaning, (8:47) there is no liquidity here at all. (8:49) There is no liquidity at all. (8:50) So in your market, (8:52) in this range, (8:53) now there is no volume in the market from here, (8:55) it does not mean that there is a new range in the market.
(8:57) No. (8:58) If you expand it like this, (9:01) suppose I expand it to the left side, (9:03) so the area that will take us, (9:06) that area is such a zone in the market, (9:09) from where the market is already working as a supply, (9:12) or demand, (9:13) or support, (9:14) or resistance. (9:15) And in the same area, (9:18) when your buy-sell activity happens, (9:22) auctions, (9:23) and your bid, (9:25) offer, (9:26) in that particular area, (9:29) where the volume is exactly equal to zero, (9:32) that area where people are not willing to trade in the market, (9:37) there is a vacuum of liquidity, (9:39) and a vacuum of volume is created, (9:41) it creates a gap.
(9:43) And whenever the market comes in that gap, (9:45) means, (9:46) in this whole candle, (9:47) this area, (9:48) where you have this zone, (9:51) in this zone, (9:52) in this whole candle, (9:55) in this zone, (9:56) before the top, (9:57) the most trade happened here, (9:58) and after this, (9:59) the market did not stop suddenly, (10:01) and after such a big jump, (10:03) it stopped here. (10:05) This happens because, (10:06) when this candle was trading here in the market, (10:09) let me color it a little so that we can see it, (10:13) when this candle was trading here, (10:14) in the middle of this, (10:16) no one was going to stop it here, (10:20) means, (10:20) in the past, (10:21) whatever buy-sell activity has happened here, (10:23) in the middle of that, (10:24) this area here, (10:26) the volume is exactly equal to zero, (10:28) there is no appearance of a market participant here, (10:31) so whenever the market comes in such a zone, (10:34) and there is no one to defend that area, (10:36) so if the market is going bullish from here, (10:39) and there is no one to stop it here, (10:41) there is no strong resistance, (10:42) then the market suddenly jumps from here and goes up very fast, (10:47) or whenever the market is coming down from here, (10:50) and there is no one to stop it in the middle, (10:53) there is no strong support, (10:54) there is no defendant, (10:55) so the market falls down very fast from there, (10:58) so here in the absence of volume in the market, (11:01) because of the liquidity vacuum in the market, (11:03) the market suddenly made a big bar from here, (11:07) the retailers feel that there is a big bar in the market, (11:10) there is a very strong volume here, (11:12) so the volume has nothing to do with the big or small canals in the market, (11:17) you must have seen many times, (11:19) that the market is doing buy-sell activity in a particular zone for a long time, (11:28) but in the price, (11:30) there is no significant change, (11:32) that is, there is not much growth, (11:34) whether it is buy-side or sale-side, (11:35) suppose there is this canal, (11:37) so the volume of this canal can be more than that of this canal, (11:44) even if the size of the canal is small, (11:46) hypothetically speaking, (11:48) I am not talking about this canal only, (11:50) the volume has nothing to do with the size of any canal, (11:54) the volume depends on the price in the market, (11:57) suppose there is a price here, (11:58) if I talk about the price from here to here, (12:02) if the price of any asset or any instrument has to go up to here, (12:09) suppose 100 people are buying to take it up, (12:13) and 200 people are selling to take it down, (12:17) so in this activity, (12:19) if both people are doing equally buy-sell, (12:23) then there will be no significant change in the price, (12:26) but the volume is increasing, (12:27) that is, the buyer wants to take it up, (12:31) and the seller wants to bring it down, (12:34) and if both are doing equally, (12:36) or a little more or a little less, (12:38) if they keep doing buy-sell activity, (12:40) then the volume of the canal will increase continuously, (12:43) but the price will not move much, (12:46) that is, the price will not move much, (12:49) if the price does not move much, (12:51) then in any canal, (12:53) we will not see much change, (12:56) this means that the volume we are seeing, (13:00) depends on the activity of buy-sell in the market, (13:04) in the activity of buy-sell, (13:06) the buyers who buy, (13:07) or the sellers who sell, (13:09) who is how effective, (13:11) who is how effective, (13:12) whoever is more powerful in the matter of money, (13:14) will take the market to that side, (13:16) let's come back to the big bar, (13:18) in this big bar, (13:19) there is no volume here, (13:21) in the market, (13:23) to carry the market up, (13:26) there is a concept in the market, (13:28) whenever we put a fixed range, (13:30) or any session volume profile, (13:33) the lowest volume node, (13:36) the lowest volume node, (13:37) for us, (13:38) works like a signature of resistance or support, (13:43) now how does it work like a signature of support or resistance, (13:47) although wherever there is a gap, (13:49) if there is a gap here, (13:51) it is not your support or resistance, (13:53) but it works like a signature of support or resistance, (13:57) means, (13:58) it is at the edge of a high volume node, (14:02) means, (14:02) it is at the edge of a high volume, (14:05) this means, (14:06) this area, (14:07) where there is no volume, (14:10) in this area, (14:11) if any price, (14:13) is attempting down, (14:15) and the market, (14:16) is attempting down, (14:18) in this area, (14:20) or not closing below it, (14:22) if it moves up and down again and again, (14:27) this means, (14:28) the people, (14:29) on this boundary, (14:30) means, (14:31) you can see this gap, (14:32) below this low volume boundary, (14:35) means, (14:35) the people below it, (14:37) who have bought here, (14:40) to defend their level, (14:42) if they continue buying, (14:43) this means, (14:44) this means, (14:44) the buyers below this lowest price, (14:48) are not accepting the price, (14:51) this means, (14:52) if below this area, (14:54) whenever a price comes, (14:56) this means, (14:57) the people below it, (14:58) to defend their level, (15:00) are failing, (15:02) and the sellers, (15:03) are effectively pushing the price down, (15:06) this is why, (15:06) the lowest volume node, (15:08) works like a fair value gap in the market, (15:11) but in fact, (15:12) it is a strong support, (15:13) or not a resistance, (15:15) but a strong support, (15:16) or resistance, (15:17) it remains as a signature, (15:19) like, (15:19) in this whole canal, (15:20) this is the area, (15:21) where the highest number of buyers have come, (15:24) and in this highest number of buyers, (15:25) if you see, (15:26) there is a red bar at the top, (15:29) and there is a green bar here, (15:31) that is the value area high, (15:32) and the value area low bar, (15:34) like here, (15:35) there is VH, (15:36) that red one, (15:37) and VL, (15:39) value area low one, (15:39) if I blue this, (15:40) you can see, (15:41) this is the value area low one, (15:42) so here, (15:43) usually, (15:44) many people make videos on YouTube, (15:45) and say that, (15:46) in the market, (15:46) your value area, (15:48) 70% by default, (15:49) works well, (15:50) it should be kept at 70%, (15:51) but we don't believe in 70%, (15:52) 20%, (15:53) 80%, (15:53) in the market, (15:55) that concept, (15:58) which we can, (16:00) modify, (16:01) any such tool, (16:03) any such area, (16:04) which we can manipulate, (16:05) any such instrument, (16:06) any such technique, (16:07) which we can manipulate, (16:08) which we can edit, (16:10) that is not reliable, (16:12) so, (16:12) in this part, (16:12) in this full, (16:13) fixed range, (16:13) volume profile tool, (16:14) which we have drawn, (16:15) this value area, (16:16) volume, (16:17) we can manipulate this, (16:18) if I do 75, (16:20) then it will come at 70%, (16:21) it will tell, (16:22) in the market, (16:23) this 70% area, (16:24) where the highest bias is taken, (16:26) so, (16:26) this is manipulated for us, (16:27) means, (16:27) we can manipulate this, (16:29) if we do 10, (16:29) then it will be 10 here, (16:31) so, (16:31) what we can manipulate, (16:33) which we can change, (16:34) that is not reliable, (16:36) so, (16:36) what is reliable, (16:37) reliable are those things, (16:38) which we cannot manipulate, (16:40) if in this full candle, (16:41) if in this full candle, (16:42) in this full candle, (16:43) which I have drawn on big bar, (16:45) in this full candle, (16:46) this is the area, (16:47) which has point of control of black color, (16:50) we cannot change this point of control, (16:53) means, (16:53) this point of control of black color, (16:56) which you see here, (16:57) we cannot change the position of this point of control, (17:01) we cannot manipulate, (17:03) this is reliable, (17:04) we have to trust on this, (17:05) not on our value area high, (17:07) and value area low, (17:09) so, (17:09) now you will say, (17:10) Because when we don't want to do this value array on high and low, then why I am using it? (17:14) I am using it here so that we get a distance to mark a zone along with a fixed range. (17:22) Like if I simply expand the POC from the horizontal ray line, then a thin line of point of control is formed.
(17:34) If there is a thin line below it, then it will look a little odd. (17:38) And according to this, it is a little difficult for many people to define the range in the market. (17:44) So what we can do is, instead of just using the POC, we can use the value array of 25 or 20 for a range.
(17:54) And instead of marking this POC like this, we can draw a rectangle box like this. (18:06) Drawing this zone means that we have drawn the POC along with 25% of the market where there was the most buy sell. (18:21) I will make it a little thicker so that you can see it.
(18:29) We have drawn this here. (18:30) This means that we have drawn a strong resistance line here. (18:36) This resistance line can also be a support line if the market breaks it and goes up or survives on it.
(18:42) Let's come back to the large channel. (18:44) Since there was no volume in the dig bar, the market went up. (18:49) So if you buy here and put your ASL here, then technically the stop loss in the market will be very high.
(18:56) Plus, this is the area of the market where many traders have bought late due to frustration. (19:05) By buying late, it means that those who have started buying from the bottom to the top, (19:12) when they get a good price at the top, definitely they will go for the profit booking. (19:18) When they go for the profit booking, the market will turn red.
(19:21) This means that the market will come down. (19:24) So the market does not fall only due to profit booking. (19:27) There are many reasons for the market to fall.
(19:29) In the market, when no market maker or dealer is ready to pay more than 75,000, (19:41) so if a market maker or buyer has to take more than 65,000, (19:47) so 66,000, 70,000, (19:49) till the time no one agrees to pay a higher price, it will not rise. (19:54) If anyone buys a quantity, then there should be a seller. (20:00) If no seller is there, then you cannot buy.
(20:03) If no buyer is there, then you cannot sell. (20:07) So in this large channel, there is no volume in the market. (20:11) In this area, the market has been the most buy-sell.
(20:15) This is the area where percentage-wise and volume-wise, the market has been the most buy-sell. (20:21) In this buy-sell wave zone, if the market survives from here, (20:30) means if a candle is being made, if we take support on it and close a green on its high, (20:36) means the things that are decreasing in the market are not very important. (20:42) The candle that is being made or the buy-sell that is decreasing, (20:46) what happens after that matters.
(20:49) Means this green-colored candle that you made, this is our past. (20:54) What is going to happen after this or what is happening after this is important for the market. (20:58) Means for the market, past means ghost is not important.
(21:03) Future means future is important. (21:05) Means the current candle that was made here, there is no importance of it. (21:10) The candle that is being made after this in the market, (21:12) means the current things that are being made, what is going to happen after that, (21:17) those things matter more.
(21:18) So after this green-colored candle, a red-colored candle was made. (21:22) What did it do? (21:23) In the market, the strongest percentage-wise and volume-wise buy-sell zone, (21:31) was closed in the market below this zone. (21:34) This means that the market is not accepting the higher price above this candle.
(21:39) Means if in the market, if someone will not tolerate it, (21:44) if someone will not be ready to pay the price above it, (21:48) then automatically the market will go down from here, (21:51) where the next liquidity will be there. (21:54) So if the market from here, the highest buy-sell point of control, (21:59) value-area-high and value-area-low, (22:02) the range that we have drawn here, (22:05) then the zone that trades the most here is this area, (22:10) and below that is this area. (22:12) We have expanded this whole area, (22:14) so here your highest buy-sell has happened.
(22:16) I will show you a very small thing on this. (22:19) If I draw here, then you will see a row, (22:22) I will do this in orange so that you can see it. (22:25) This is the orange area where the lowest volume has been traded.
(22:30) Now this market is not surviving above this lowest volume, (22:34) means no one is ready to trade above it. (22:39) If no one is agreeing to buy-sell above this zone, (22:44) automatically this small volume becomes a signature for the resistance. (22:50) This means that if the market is not able to survive above it, (22:54) means no one is agreeing to buy-sell above it, (23:00) it is becoming a signature of the resistance, (23:03) and the market will go down to the zone where it will get liquidity, (23:08) means no one will agree to buy-sell below it.
(23:12) Now when the market will come down, (23:13) then the people who had bought here and put their ASL at the bottom, (23:17) this is your sell-side stop-loss, (23:22) means if you have put the stop-loss at the bottom, (23:24) then it is called sell-side ASL, (23:27) and if you have put it at the top, (23:28) if the market is falling below you, (23:30) and you have put the ASL at the top, (23:32) then it is called buy-side ASL. (23:34) So whenever your sell-side ASL, (23:37) means the stop-loss below any bullish candle, (23:41) when the market will hunt it, (23:43) then it will get strength, (23:44) there will be an increase in liquidity, (23:45) and the market will try to go to the next zone, (23:49) unless it gets a stop-loss below it, (23:53) means there is no strong support below it, (23:56) and this is the reason, (23:57) whenever the market falls below your high-volume notes zone, (24:02) and the area from where there is no strong support in the market, (24:07) then what is that zone? (24:09) Again, the area where there is the most buy-sell in the market, (24:13) that is the strong support for the market, (24:16) it works like a resistance, (24:17) but since we are not talking about the whole session, (24:20) we are not talking about the whole zone, (24:22) we are talking about a particular big bar, (24:25) so here we have this area, (24:27) which is the area which has the most buy-sell above it. (24:31) If the market closes below this zone, (24:35) it means that in the market, (24:37) it will work like a strong resistance, (24:39) and in any case, the market will go below it, (24:42) there is no question of going up, (24:44) but suppose the market comes down, (24:47) and closes above it again in green, (24:50) if the market closes above it in green, (24:53) it means that in the market, (24:55) the zone which was working as a strong resistance, (24:58) if a big player buys below it, (25:01) and pushes the market above this resistance, (25:05) then the market will become a strong support area for this channel.
(25:09) This is the reason why in the market, (25:12) supply-demand, support-resistance, (25:13) order-block, (25:14) there are many concepts which are roaming in the market, (25:17) but people are not able to differentiate between them, (25:20) some say order-block, some say support, (25:22) some say resistance and supply, (25:24) in the market, you say supply, (25:26) say resistance, (25:27) say order-block, (25:28) it is the same thing, (25:29) you say support, (25:31) say order-block, (25:32) or say demand, (25:33) it is the same thing, (25:34) so the market came down after the big bar, (25:35) and the market will keep coming down, (25:39) until there is a zone where there is no one to stop it, (25:44) and it will fall till there, (25:45) so we should never take entry in the market on the big bar, (25:49) after the big bar, (25:50) always wait, (25:51) that the big bar is being made, (25:53) the big channel is being made, (25:54) what is happening after that, (25:56) suppose this became a big bar, (25:58) so after this big bar, (25:59) you don't have to do any buy activity, (26:02) after this big bar, (26:03) you have to do activity, (26:04) after this, (26:05) you have to wait, (26:06) that what channel is being made after this, (26:08) the channel that will be made, (26:09) will decide, (26:10) that the market will move up from here, (26:12) or will move down, (26:14) like this, (26:15) we have Nik pro, (26:17) in order flow and volume foot print mentorship, (26:19) the one-to-one and group classes, (26:21) in detail, (26:22) in 20 classes, (26:23) in 20 modules, (26:24) we talk about a lot of things, (26:26) in order flow, volume profile, volume foot print, (26:28) include everything, (26:29) but this trading library section, (26:31) I will do my best, (26:33) that every single week, (26:34) and every single month, (26:35) I will bring the best videos for you, (26:37) so that you, (26:38) in the world of an indicator, (26:39) RSI, MSA, Bollinger bands, (26:41) and the fake mentors, (26:42) you are free from them, (26:45) and purely you, (26:46) in order flow and volume foot print, (26:48) the concepts that are there, (26:49) on behalf of that, (26:50) you can trade better, (26:51) those who can't afford mentorship, (26:54) for them, (26:54) very soon, (26:55) I am going to launch a recorded mentorship section, (26:58) within one and a half week, (27:00) till then, (27:01) in your trading library, (27:02) every single month, (27:03) every week, (27:04) every year, (27:05) many hundreds of videos, (27:07) are going to come, (27:08) which will help you, (27:08) in the market, (27:09) even if you have completed your mentorship, (27:10) even if you haven't, (27:11) even then, (27:12) this is going to help you for a lifetime, (27:14) and whatever learning, (27:15) I am giving here, (27:16) whatever learning, (27:17) I am giving here, (27:18) it's very rare, (27:19) in the market, (27:20) maybe someone will provide you, (27:21) everyone says this, (27:22) but I am not claiming this, (27:24) our order flow, (27:25) and volume foot print traders, (27:27) anyone can ask them, (27:28) they will answer you, (27:29) I hope, (27:29) whatever I am teaching, (27:30) it is as per world class or not, (27:32) now, (27:32) if we talk about data, (27:33) about big bar theory, (27:34) I hope, (27:36) you have understood about big bar, (27:37) here, (27:38) above big bar, (27:40) never buy in the market, (27:42) if it is of sale side, (27:44) then after big bar, (27:45) you don't have to sell, (27:46) you always need to wait, (27:47) until, (27:48) next can you form in the market, (27:50) for example, (27:50) Mr. Malik, (27:51) let me give you some more, (27:52) here, (27:53) if we have market, (27:54) this is a big bar, (27:56) of red blood, (27:57) if you see here, (27:58) everyone here, (27:59) can see, (27:59) this is a big bar, (28:12) of red blood, (28:18) if you see here, (28:24) this is a big bar, (28:25) of red blood, (28:26) can see, (28:27) this is a big bar, (28:27) if you see here, (28:28) this is a big bar, (28:29) of red blood, (28:29) of red blood, (28:29) let's suppose, (28:29) I have drawn here, (28:30) only on this candle, (28:31) so in the market, (28:32) this is the area, (28:33) from top to bottom, (28:34) if you see here, (28:35) in the market, (28:36) why the market went up, (28:37) because the market, (28:38) came down from here, (28:39) in this particular candle, (28:41) in this area, (28:41) most of the buyers, (28:43) have sold, (28:44) and in this zone, (28:45) in the market, (28:45) below this, (28:46) whatever data is there, (28:48) market is ready, (28:48) to go below this, (28:50) because the people, (28:51) who have, (28:52) order here, (28:53) limit order, (28:54) pending order, (28:55) they are trying, (28:56) to defend their level, (28:57) so that area, (28:59) where, (29:00) the lowest volume, (29:01) means, (29:02) in this row, (29:03) you can see, (29:04) here is the lowest volume, (29:05) now, (29:06) this is the lowest volume, (29:07) area, (29:08) which in the market, (29:09) is working, (29:09) as a support, (29:10) or as a resistance, (29:12) means, (29:13) if this market, (29:14) came down suddenly, (29:15) here, (29:16) the volume, (29:16) is equal to zero, (29:17) in all these areas, (29:18) and in this area, (29:19) in the market, (29:20) this is the area, (29:20) where most of the buyers, (29:22) have sold, (29:22) and if the market, (29:23) is defending from here, (29:24) next time, (29:25) the market will come, (29:25) when, (29:26) below this low, (29:28) means, (29:28) below this area, (29:29) when a red candle, (29:30) will close, (29:31) then your entry, (29:32) should be of buy sell, (29:34) but, (29:34) in order flow, (29:35) when we learn, (29:35) in volume profile, (29:36) in order profile, (29:37) we learn, (29:38) a lot of our, (29:38) RJF theories, (29:40) learn ABR theories, (29:41) learn PRM, (29:42) in that, (29:44) you don't have to wait, (29:44) for the zone to break, (29:46) we easily, (29:47) in the top, (29:49) by using the, (29:50) order flow concepts, (29:51) which our, (29:52) one to one, (29:53) and group mentorship, (29:55) if you don't know, (29:56) then in the coming time, (29:57) in this type of videos, (29:58) we will provide you, (29:59) best order flow and volume footprint trading education. Thank you.
Big Candle Trap and FRVP: Common Questions
Quick answers on why large breakout candles trap traders, what Fixed Range Volume Profile shows, and how to read acceptance versus rejection before entering a trade.
The big candle trap is when traders enter a position at the close of a large breakout candle, which is often the worst price on the chart. A large candle forms by sweeping through a thin order book, so its interior holds very little traded volume. When early buyers take profit and late entries get stopped out, price falls back through that empty zone quickly, trapping anyone who chased the breakout.
Because the inside of a large candle is a low volume vacuum. Very little two-sided trade happened at those prices, so there are almost no resting orders to support a pullback. Once price re-enters the candle's range, it moves fast until it reaches the origin of the move, where real volume was last traded.
Fixed Range Volume Profile is a charting tool that shows how much volume was traded at each price level within a range you select. It displays high volume nodes where the market accepted price and built positions, and low volume nodes where price was rejected and moved through quickly. Traders use FRVP to identify where resting liquidity actually exists.
FRVP shows whether a breakout is being accepted or rejected. If price holds beyond the high volume area and new volume builds there, the move has acceptance. If price pokes beyond the value area and snaps back inside with no volume building, the breakout is being rejected. Reading this before entering helps a trader avoid chasing moves that reverse.
Low volume nodes produce sharp short-term reactions at their edges, but the resting orders creating those reactions sit in the high volume nodes next to them, not inside the low volume zone itself. Price either rejects cleanly at the edge of a low volume node or cuts through it fast toward the next high volume area. It rarely holds inside the gap.
Avoid the Big Candle Trap with Fixed Range Volume Profile (FRVP)