We Teach Trading — Zero Tips, Zero Advice, Zero Recommendations. Not registered with SEBI or any financial regulator worldwide.
We Teach Trading — Zero Tips, Zero Advice, Zero Recommendations. Not registered with SEBI or any financial regulator worldwide.
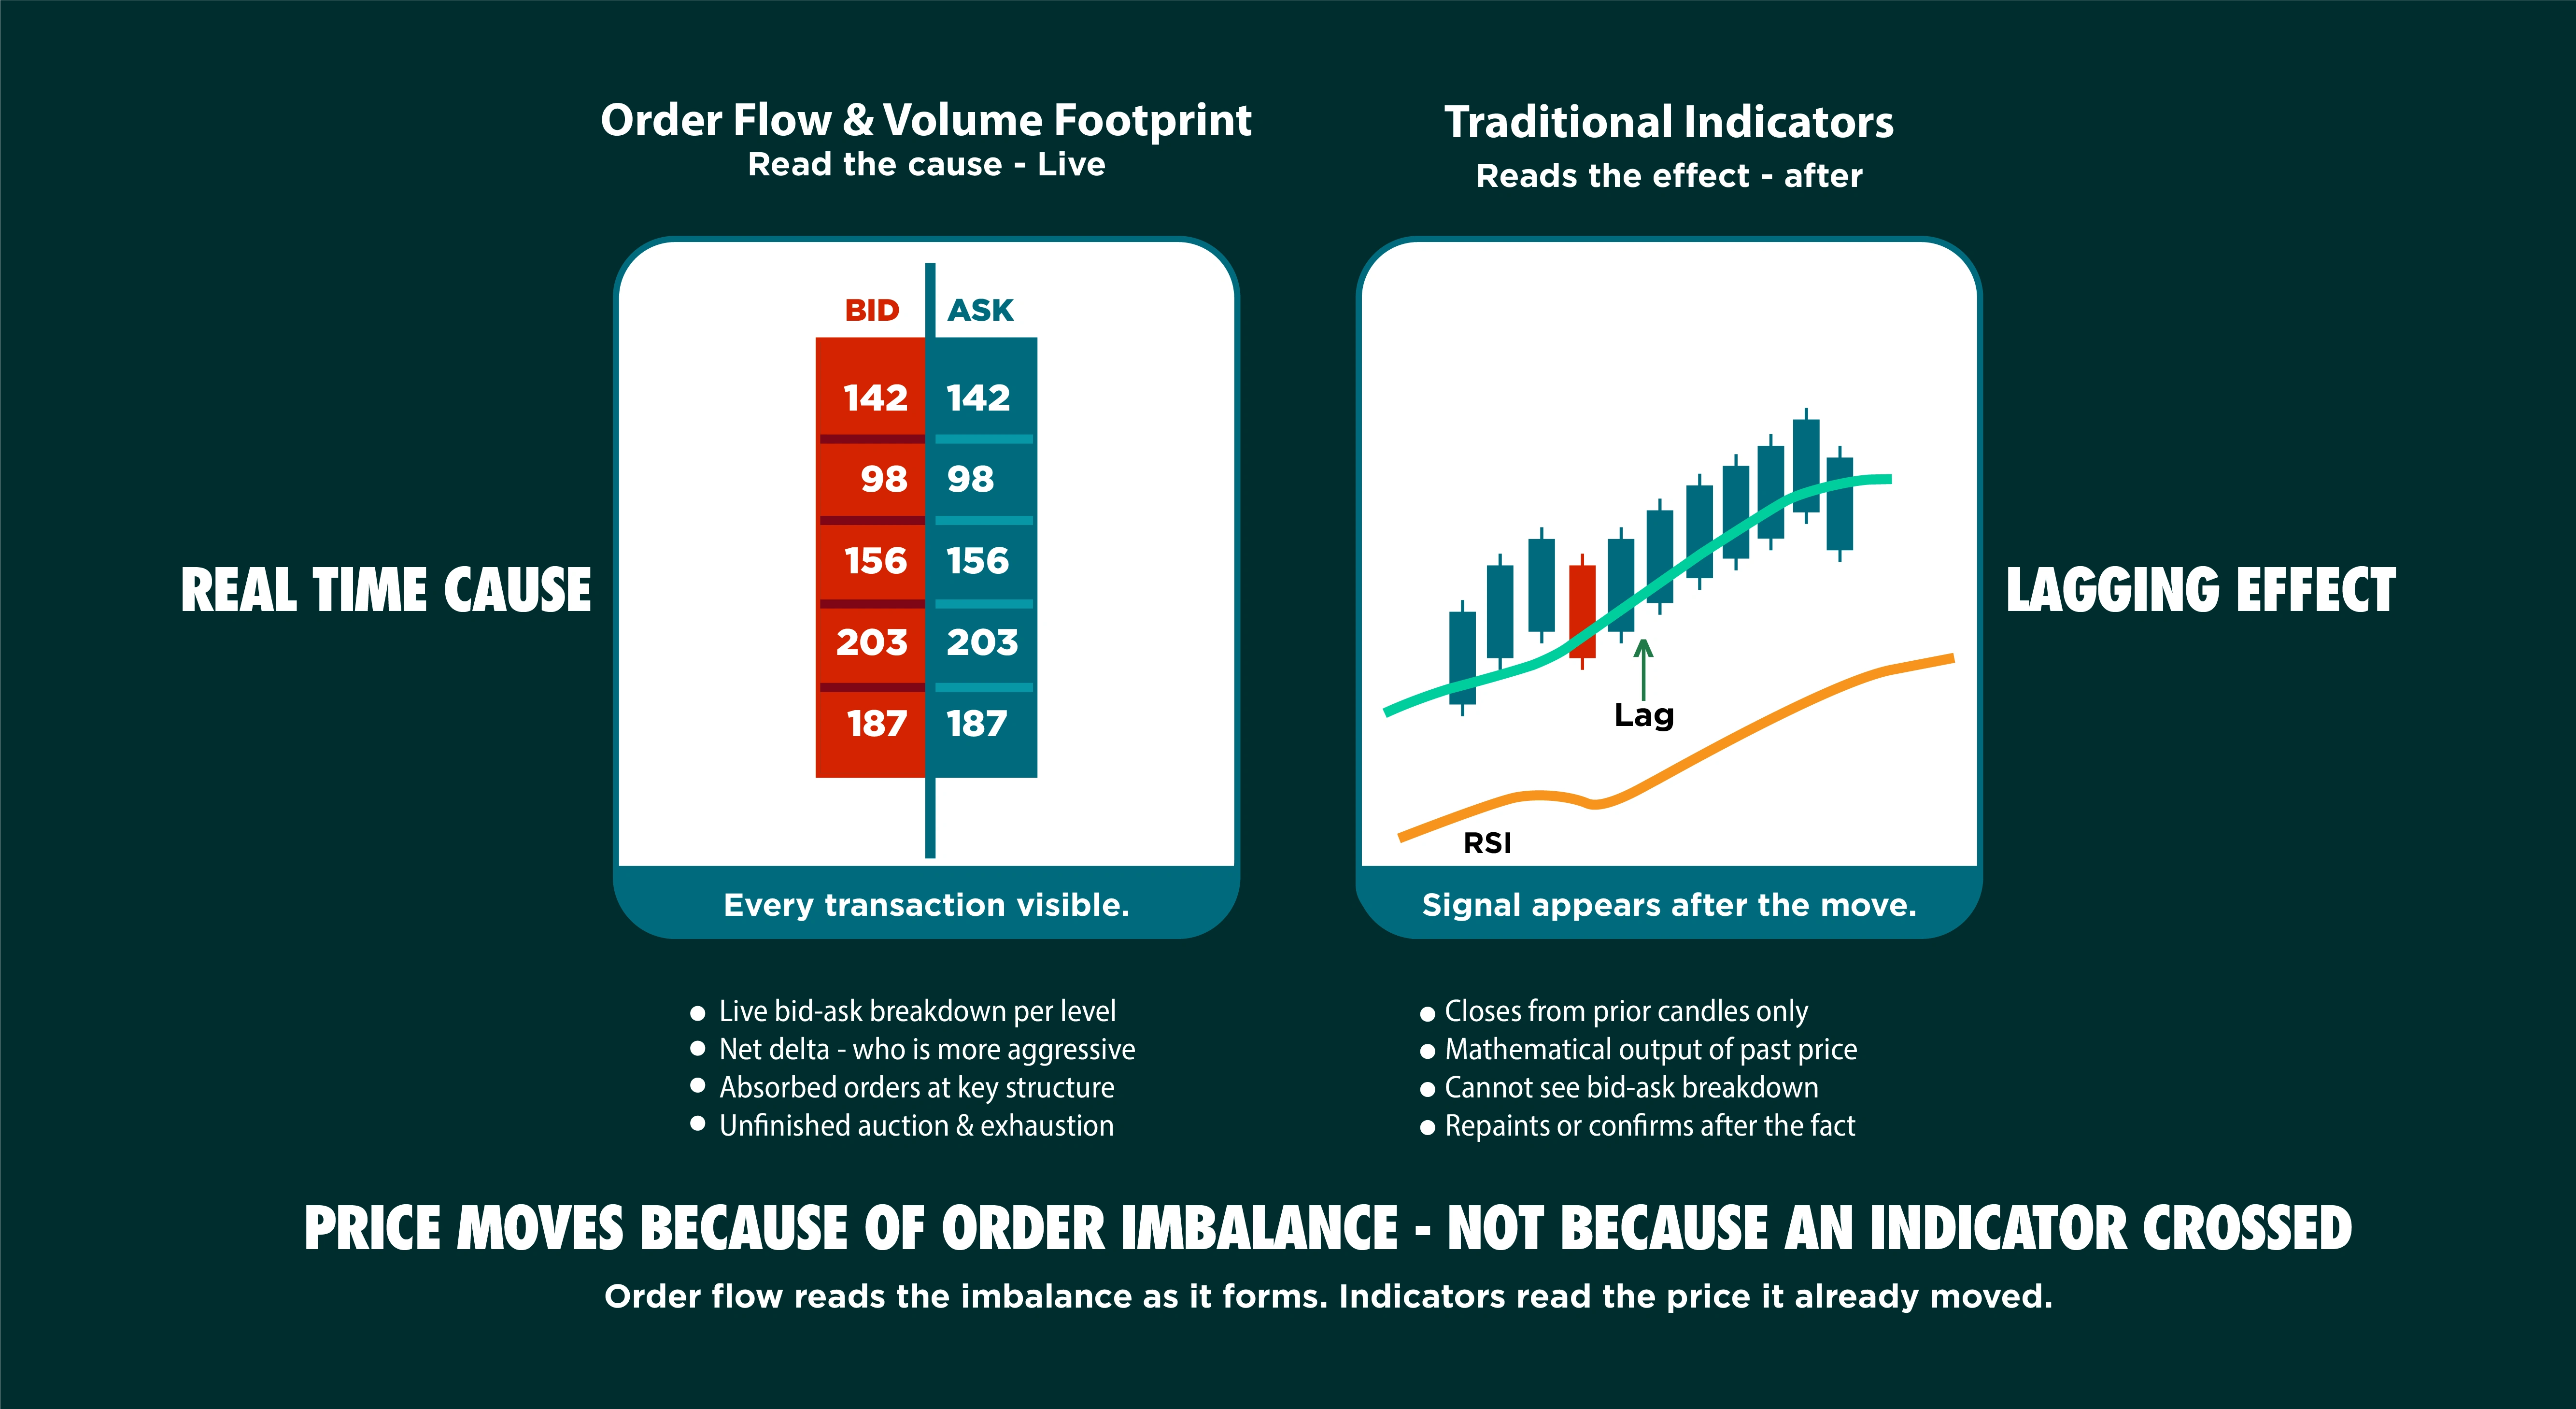
A straight comparison of two fundamentally different ways of reading price. One reads what happened. The other reads what is happening right now.
At some point, every trader who has spent time on charts stares at a screen full of moving averages, RSI lines, MACD histograms, and Bollinger Bands - and asks a simple, uncomfortable question: why did this still not work?
I asked that question around 2001, seven years into my trading journey. The answer I eventually found didn't come from a better indicator or a new combination of signals. It came from understanding something far more fundamental: what price actually is, and what moves it.
This article is an honest comparison of two approaches - indicators and order flow with volume footprint. Not a sales pitch for either. Just what I have observed over three decades of watching markets, studying institutional behavior, and teaching traders across four continents.
This is the part most indicator courses skip.
Every traditional indicator - RSI, MACD, Stochastics, Bollinger Bands, EMA, Supertrend, ADX - is built from the same raw material: price and sometimes volume. What an indicator does is take that raw price data and run it through a mathematical formula. The output - the line, the histogram, the band - is not new information. It is derived, processed, and time-delayed information.
Take a 14-period RSI. It calculates average gains and average losses over the last 14 candles, divides them, and maps the output between 0 and 100. Every data point in that calculation has already closed. You are looking backwards.
An EMA is a weighted average of past closing prices. MACD is the difference between two EMAs. Bollinger Bands are a moving average with a standard deviation envelope around it. Stochastics compares the latest close to a range of past closes.
None of these tools observe the market. They describe it - after the fact.
Indicators are not worthless. Used correctly, they can:
Help identify overall trend direction on higher timeframes
Provide a systematic, repeatable framework for traders who need structure
Reduce emotional decision-making for beginners who otherwise overtrade
Offer visual reference points for broad context
The limitation is not the indicator itself. The limitation is believing it shows you something the market is doing when it only shows you something the market did.
Order flow is not an indicator. It is not derived data. It is the raw mechanism by which price moves.
Price moves for one reason only: an imbalance between buyers and sellers at a specific price level, at a specific moment in time. When buyers are more aggressive than sellers - when more market orders are hitting the ask - price moves up. When sellers are more aggressive - when more market orders are hitting the bid - price moves down.
Order flow is the study of that imbalance as it is happening.
The Depth of Market (DOM) shows you the limit order book in real time - where buyers and sellers have placed resting orders and at what quantity. The tape (time and sales) shows you every executed transaction: price, size, direction.
Together, they tell you not just where price is but how it got there and who is responsible.
A footprint chart - also called a volume profile per candle or bid-ask footprint - breaks each candle into its component transactions. Instead of showing you just open, high, low, close, it shows you:
How many contracts or lots traded at each price level inside the candle
The split between buying aggression (hitting the ask) and selling aggression (hitting the bid)
Delta: the net difference between aggressive buyers and aggressive sellers at each level
Cumulative delta: how that imbalance has built up across a session
A candle that closes green on a conventional chart might show deeply negative delta on a footprint - meaning aggressive selling dominated the move. That is a warning signal no indicator can show you. Price went up, but the pressure underneath was bearish. That is actionable information.
Volume Profile - whether it is a daily, weekly, or session profile - shows you where the most trading activity has occurred at each price level. The Point of Control (POC) is the price where the highest volume traded. Value Area High and Value Area Low bracket the zone where roughly 70% of session volume occurred.
These are not arbitrary lines. They are mathematically derived levels that reflect where institutions actually transacted. Price tends to revisit areas of high volume and react at those levels because the participants who built positions there have an economic reason to defend them.
This is the single most important concept in this comparison.
When an institution buys 50,000 contracts, price rises. The RSI goes up. The MACD crosses bullish. Bollinger Bands expand. Every indicator reacts - after the transaction that caused the move has already occurred.
Order flow lets you observe the transaction itself: the delta shift, the absorption of sell orders by aggressive buyers, the depletion of limit orders on the ask side. You are watching the cause unfold.
That is the difference between following a shadow and watching the object that casts it.
Any educator who tells you order flow is perfect or infallible is either inexperienced or dishonest. Here is what order flow and footprint analysis genuinely cannot do:
It cannot tell you what will happen. It tells you what is happening. The future is always uncertain.
Delta divergence is a warning signal, not a guaranteed reversal. Price can continue against an imbalance longer than expected.
Footprint data requires a reliable data feed. Poor tick data produces misleading footprints. Not all platforms deliver accurate bid-ask splits for every instrument.
Reading footprints in real time requires practice, screen time, and pattern recognition that takes months to develop properly.
On less liquid instruments and smaller timeframes, noise in the data can produce false readings.
The skill ceiling is high. Order flow is not a simpler alternative to indicators. It is a deeper level of market understanding that demands more from the trader, not less.
Order flow is not for people looking for an easier path. It is for people who want to understand markets at a structural level and are prepared to invest the time to develop that understanding properly.
Retail traders use indicators. Institutional participants - proprietary trading firms, hedge funds, market makers, and large banks- use order flow, liquidity mapping, and volume analysis.
This is not speculation. It is observable in the data. Watch how price behaves when it approaches a high-volume node from a prior session. Watch how large block trades appear in the footprint before a significant move. Watch how delta divergence precedes reversals at key structural levels.
Institutions do not act on an RSI reading. They act on liquidity - where it is, where it is not, and where they can execute size without moving the market against themselves. Understanding their footprints in the data is the closest a retail trader can get to reading institutional intent.
Indicators: lagging by design. The signal comes after price has moved.
Order flow: real-time. You are observing the auction process as it unfolds.
Indicators: surface level. Price and sometimes volume, processed into a single output.
Order flow and footprint: structural. You see price, volume, bid-ask breakdown, delta, absorbed orders, and exhaustion signals at every level within every candle.
Indicators: lower barrier to entry. Rules are explicit. Crosses, levels, divergences are visually clear.
Order flow: steeper entry. Requires understanding of market microstructure, auction theory, and the mechanics of how exchanges match orders.
Indicators: can create false certainty. A confluent signal from five indicators still fails routinely because they are all measuring the same thing.
Order flow: builds contextual understanding. When a trade does not work, the footprint usually explains why. That explanation informs the next decision rather than leaving the trader confused.
Indicators: work reasonably on any liquid instrument across any timeframe.
Order flow and footprint: work best on instruments with deep, transparent order books - equity index futures, commodity futures, major forex pairs, and large-cap equities. Thin or illiquid instruments produce noisy footprint data.
The methodology I teach - NIC No Indicator Concepts - uses zero indicators. Not because indicators are always wrong, but because adding a derivative layer between the trader and the raw price and volume data creates an unnecessary interpretation step that slows decision-making and filters out crucial microstructural information.
Pure price action: candle psychology, body and wick analysis, engulf structures, and market structure at multiple levels
Institutional order flow: reading aggression, absorption, and delta as the auction unfolds
Volume footprint: bid-ask breakdown, POC identification, value area analysis, and unfinished auction recognition
Structural analysis: Ascending and Descending Market Structure using institutionally relevant frameworks - not retail trend lines
Fair Value Gaps: institutional imbalances that price tends to revisit
CPR and Pivot levels as mathematically derived institutional reference levels
This is not a simpler approach. It is a more direct one. Every tool used has a causal relationship with price. None of them is a derivative calculation sitting one step removed from the market.
Market microstructure research - including work by academic economists and practitioner researchers studying order-driven markets - consistently shows that:
Trade direction (aggressive buying versus selling) has predictive value for short-term price movement
Volume at price (volume profile) identifies significant support and resistance levels that participants defend
Order imbalance measured at execution level correlates with price direction more reliably than price-based technical signals in high-frequency and intraday timeframes
Limit order book dynamics - particularly the absorption of large directional orders - precede price reversals in liquid markets
This is not to say technical indicators have no place in research. Many quantitative strategies use them in systematic frameworks. The point is that the raw inputs - price, volume, order direction - carry information that indicator transformations can obscure rather than clarify for discretionary traders.
You can. Many traders begin with indicators for context - a daily EMA to identify the dominant direction, for example - and then shift to order flow for entry timing on lower timeframes. The important thing is understanding what each tool tells you and what it does not. Do not use an indicator to confirm an order flow signal and call it confluence. They are often measuring the same underlying move at different delays.
Footprint charts originated in futures markets because exchanges like CME provide transparent tick-by-tick data. However, equities traders using Level 2, time and sales, and volume profile can apply the same conceptual framework. Forex order flow is more complex because the forex market is over the counter and no central exchange captures all transactions - but proxies exist through futures equivalent data.
Yes — and among traders who know how to use it, it works exceptionally well.
Footprint analysis in options trading is applied directly to the options chart itself, not just to the underlying futures or cash instrument. This is sometimes called a premium chart - a volume footprint built on the options premium rather than the underlying price. What you are reading is the actual buying and selling aggression happening inside the options contract at each premium level, tick by tick.
Exchanges including NSE, BSE, CME, and several other major global derivatives exchanges now support real-time tick data for options contracts, and premium charting platforms have made footprint analysis on options genuinely viable for active traders. This was not always the case - the data infrastructure has matured significantly in recent years, and what was once available only to institutional desks is now accessible to serious retail traders through the right platform and data feed.
What makes footprint on a premium chart particularly powerful for options traders is the nature of what you are observing. An index option like a Nifty or Bank Nifty contract aggregates the behavior of the entire index - it reflects institutional positioning, hedging activity, and directional aggression across the full basket. When you read the bid-ask breakdown and delta on the premium chart at a specific strike, you are seeing exactly how aggressively participants are transacting at that premium level in real time. That is information no indicator, no open interest table, and no standard options chain view can give you.
The practical result: strike selection sharpens considerably. You can see which strikes are attracting genuine aggressive buying versus which are being sold into. You can observe delta divergence on the premium chart the same way you would on a futures footprint - where premium is moving in one direction, but the underlying aggression tells a different story. Exhaustion, absorption, and unfinished auctions all show up in options premium footprints exactly as they do in futures.
This is not theoretical. I personally use real-time volume footprint charts on options premium through TradingView in every single trade I take - it is a core part of how I read the market. And it is precisely what I teach inside NIC Pro Institutional Order Flow and Volume Footprint Mentorship. Students learn to read the premium chart with the same footprint framework applied to futures - bid-ask breakdown, delta, POC, value area, and absorbed orders - applied directly to the options contract they are trading. The concepts transfer completely; what changes is the instrument and the data feed you are reading them on.
For options traders who have spent years working with indicators, open interest, and PCR and feel something is still missing - this is usually what is missing. The live auction happening inside the premium itself, visible in real time, readable with the right framework.
Order flow and footprint analysis are most reliable on intraday timeframes - from one-minute to sixty-minute charts - where the real-time data provides actionable information. On daily or weekly charts, volume profile becomes more relevant than tick-level footprint. Structural analysis applies across all timeframes.
Honestly: longer than learning an indicator strategy. Developing genuine proficiency in reading footprints, understanding delta, recognising absorption, and integrating that with price structure requires consistent study and live market observation over months, not weeks. Anyone telling you otherwise is not being straight with you.
Professional discretionary traders at proprietary firms and institutional desks routinely use order flow tools. Market makers use DOM analysis as a core function of their work. The tools are not exclusive to professionals - they are available to any retail trader through platforms that provide footprint charting - but the skill required to use them effectively is developed through deliberate practice.
Neither approach is inherently superior for every trader in every context. The better question is: what kind of understanding do you want of the markets you trade?
If you want a systematic, rule-based approach with a modest learning curve, indicators provide that. Accept their lag and their limitation as derivative tools and use them accordingly.
If you want to understand markets at the level of why price moves - how institutional participants build and defend positions, where real supply and demand imbalances exist, and how to read the auction process in real time - then order flow and volume footprint are worth the serious investment of learning them properly.
I have spent three decades developing this understanding. The methodology I teach is built on it. It is not for everyone, and I do not pretend otherwise. But for traders who are genuinely serious about understanding markets rather than just collecting signals, this is where the work leads.
Disclaimer: The content of this article is published for educational and informational purposes only. Kumar Ravishanker Singh (professionally well known as Kumar Singh) and Kumar Singh Global Trading Academy (OPC) Private Limited are not registered with SEBI or any financial regulatory authority worldwide. Nothing in this article constitutes financial advice, investment advice, or a recommendation to buy or sell any financial instrument. Trading in financial markets involves substantial risk of loss. Past performance does not guarantee future results. Readers are solely responsible for their trading decisions.
Real questions from traders across five continents - on order flow, volume footprint, premium charts, indicators, and what actually moves markets. Answered by Kumar Singh.
Order flow trading is the practice of reading the real-time buying and selling activity in a market - specifically the balance between aggressive buyers and sellers at each price level - to understand the immediate supply and demand dynamic and inform trading decisions.
A volume footprint chart breaks each price candle into individual price levels and shows the volume of buying and selling that occurred at each level, along with the net imbalance between aggressive buyers (hitting the ask) and aggressive sellers (hitting the bid). This is called delta.
Delta is the difference between volume executed at the ask (buying aggression) and volume executed at the bid (selling aggression) at a given price level or across a candle. Positive delta means buyers were more aggressive; negative delta means sellers were more aggressive. Delta divergence - where price moves in one direction, but delta suggests the opposite pressure - is a key signal in footprint analysis.
The Point of Control (POC) is the price level where the highest volume of trading occurred within a defined period - a session, a day, a week, or any custom range. It represents the price at which the market found the most agreement and tends to act as a significant reference level going forward.
Indicators lag because they are calculated from historical price data. An RSI reading, for example, is the output of a formula applied to the last 14 closed candles. By definition, the candles have already closed before the reading updates. The more periods an indicator uses, the greater its lag.
Price action analysis reads the visible pattern of candles - their structure, size, position, and relationship to one another - to infer market behavior. Order flow goes one level deeper: it reads the actual buy and sell transactions that produced those candles, revealing the internal pressure even when the visible candle does not show it.
Yes, with appropriate tools and sufficient study. Platforms providing footprint charting and volume profile analysis are available to retail traders. The information advantage once exclusive to institutional participants is now accessible. However, developing the skill to interpret this data correctly requires serious commitment.
Order flow analysis works best in markets with centralized, transparent order matching and deep liquidity: equity index futures (such as Nifty 50 futures, S&P 500 E-mini, DAX futures), commodity futures (crude oil, gold), and major equity markets with reliable time and sales data. Forex is more complex due to the decentralized OTC structure.
Order flow can be integrated with structural technical analysis - support and resistance levels, market structure, and price action - without contradiction. What it does not pair well with is indicator-based signal generation, because the two approaches measure fundamentally different things at different points in time.
NIC is the proprietary trading methodology developed by Kumar Singh — founder of Kumar Singh Global Trading Academy (OPC) Private Limited. It teaches institutional order flow, volume footprint analysis, and pure price action without any traditional lagging indicators. The approach is built on the principle that price and volume are the only primary data sources - everything else is derivative.