We Teach Trading — Zero Tips, Zero Advice, Zero Recommendations. Not registered with SEBI or any financial regulator worldwide.
We Teach Trading — Zero Tips, Zero Advice, Zero Recommendations. Not registered with SEBI or any financial regulator worldwide.
Indicators lag. Order flow does not. Here is how to set up TradingView to read volume footprint on Nifty and Bank Nifty, the NIC way, with no indicators on the chart.
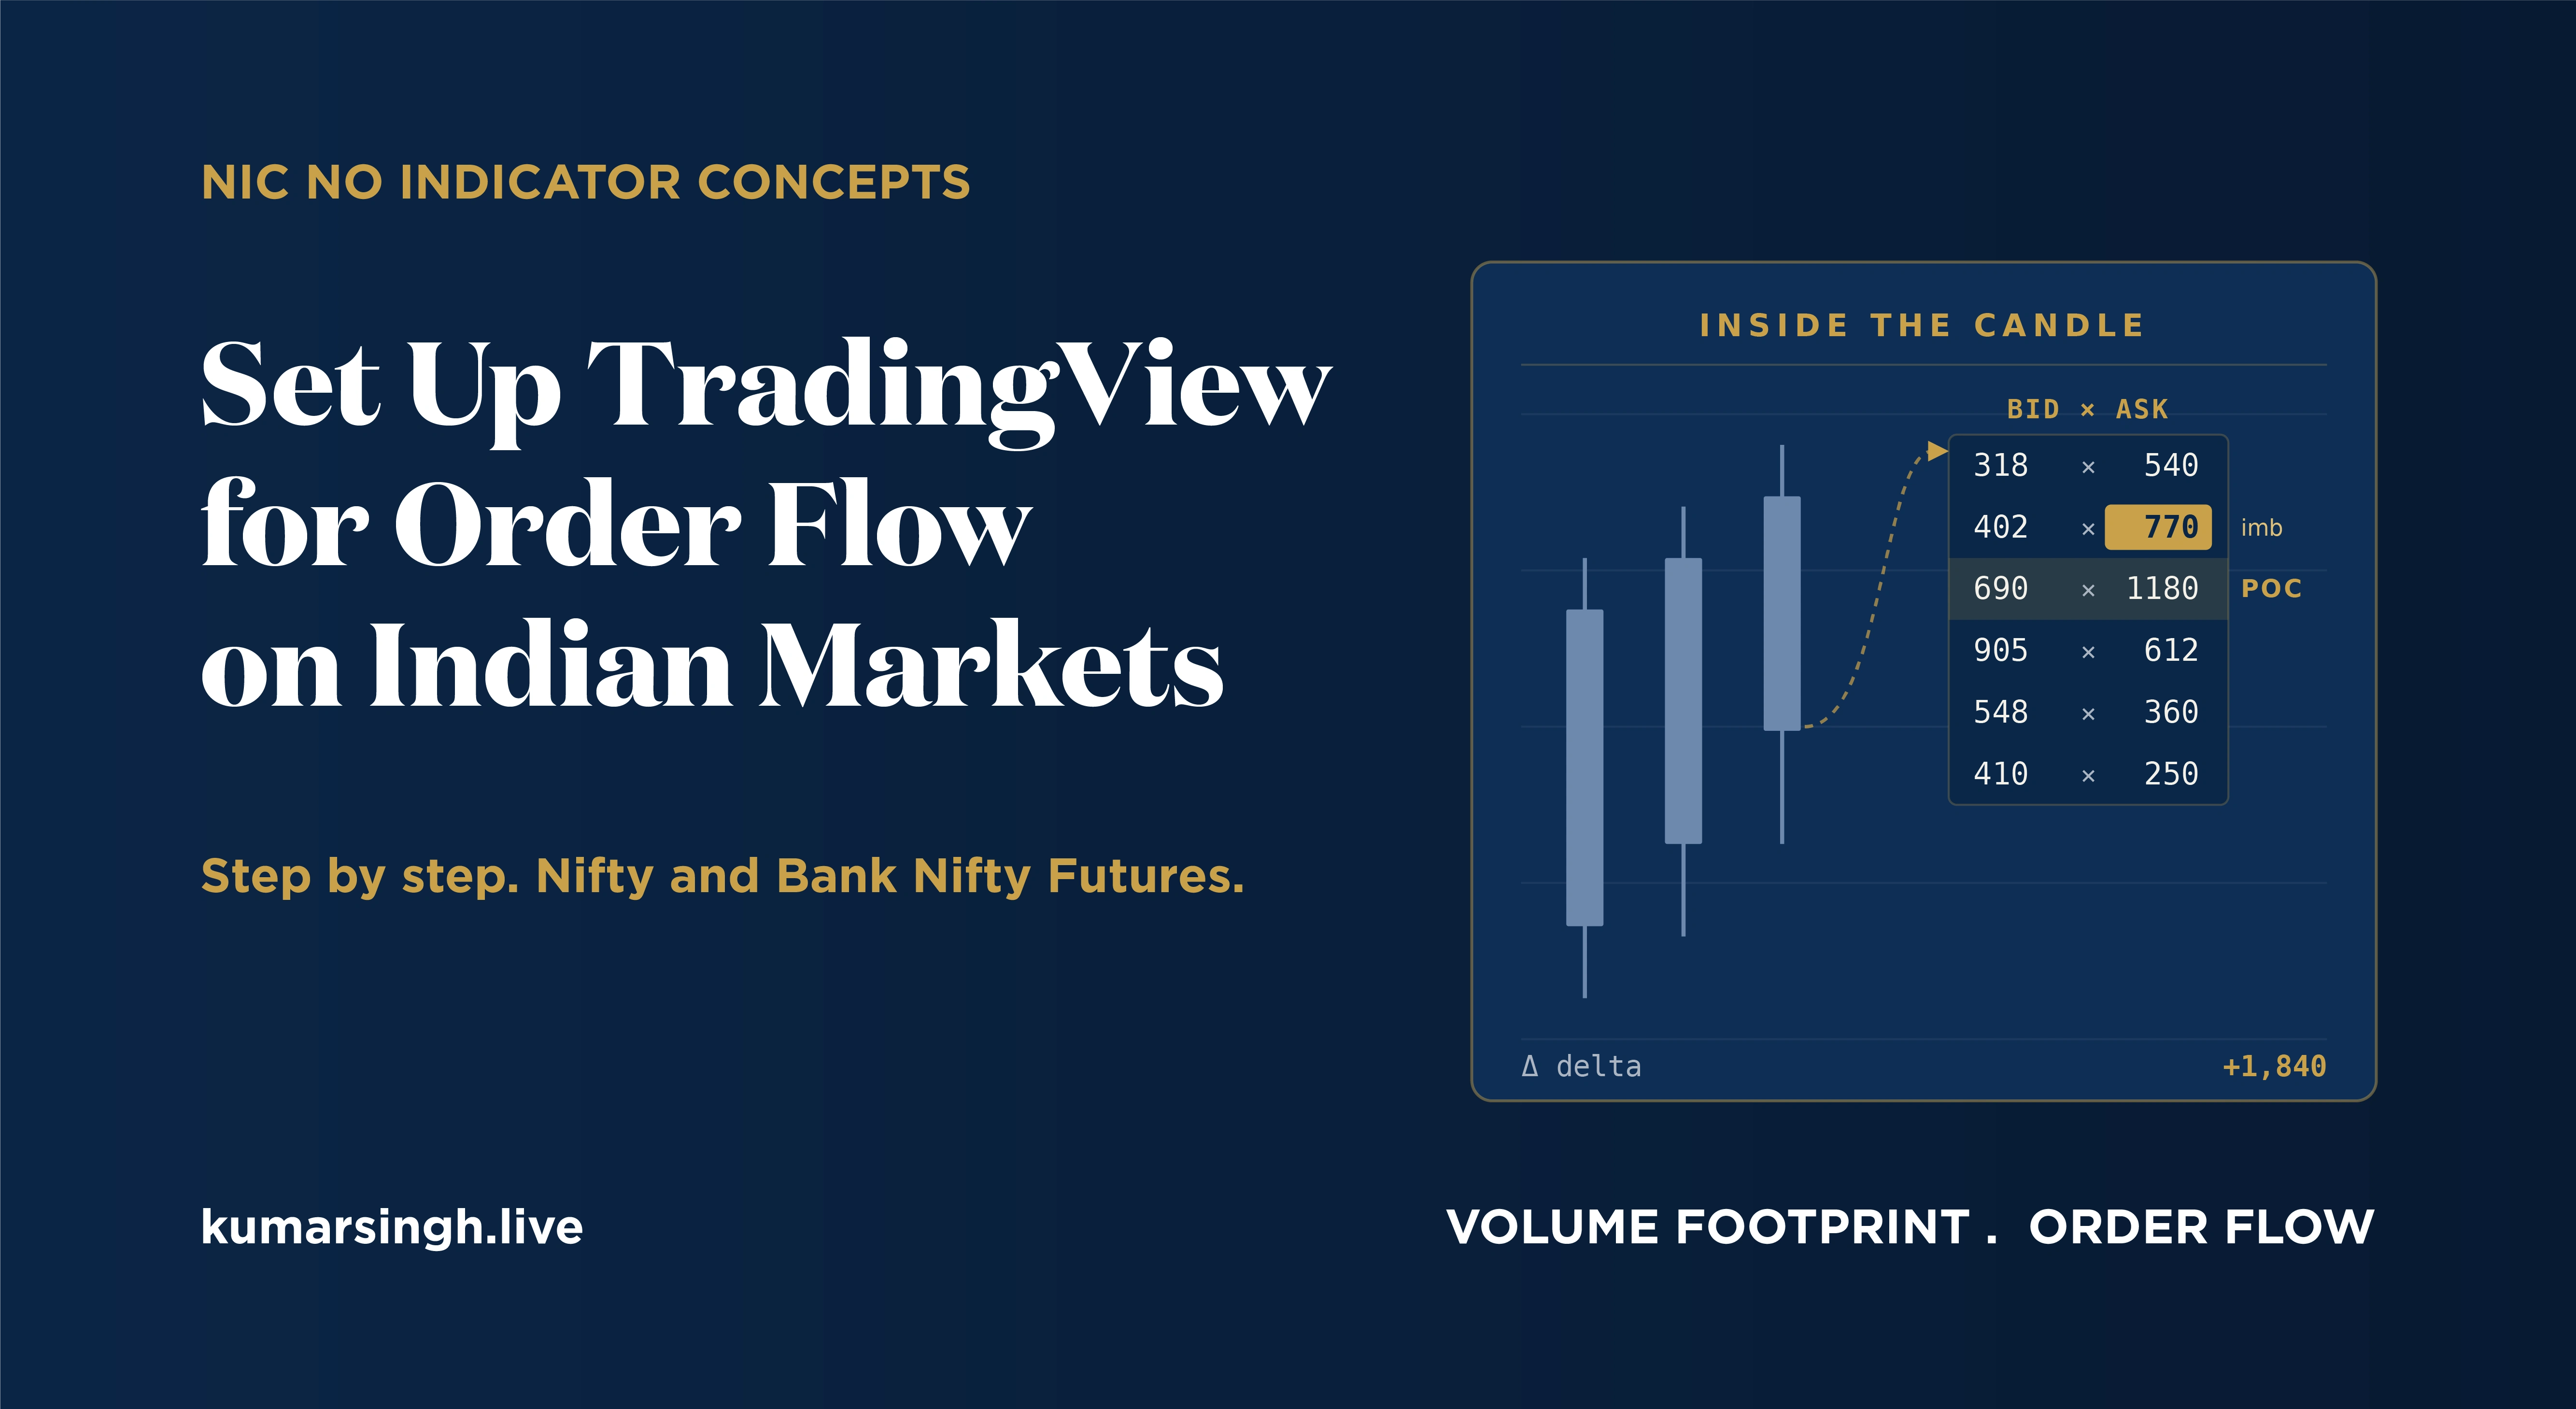
Most charts show you four numbers per candle. Open, high, low, close. Where price went, never who pushed it there. Order flow goes inside the candle and shows you the actual buying and selling at every price level. The volume that hit the ask. The volume that hit the bid. That is what a volume footprint is. Raw transactions, split by side, with no setting to smooth it and no lag to wait through.
NIC stands for No Indicator Concepts. The whole method reads what the market is doing right now, not what a line drawn from old price says it might do later. Setting up TradingView for order flow is the first practical step into that. Get the setup wrong and the chart lies to you with a straight face. Get it right and you are reading the money as it lands.
Here is how to set it up properly for Indian index futures. And the one thing about the Indian market that quietly ruins most people's footprint before they read a single number.
Three things decide whether your footprint is real or decoration. Miss any one and you are staring at a pretty chart that means nothing.
This is the part nobody wants to hear. A footprint is built from tick by tick trade data. Every transaction, at every price, on which side it hit. Standard candle data cannot build that. It does not carry the information in the first place.
So before you touch a single chart setting, you need a real-time feed that delivers trade prints at tick resolution. Without it the footprint either refuses to draw or it draws from estimated numbers. And estimated order flow is worse than none. It looks like a read. It is a guess wearing a costume.
TradingView now has a native volume footprint chart. It shows bid and ask volume at each price row, the point of control for the bar, the value area, the delta, and where one side stacked into an imbalance. That is a real order flow view, built in.
The native study is not on the free plan. If you are serious about order flow, that is the route worth paying for. There are community footprint scripts as well, but the ones built on estimated intrabar data carry the same flaw as a weak feed. They approximate. Order flow is the one place where approximate gets you hurt.
Footprint numbers read cleaner on a bar chart than on a candlestick. The candle body sits on top of the rows you are trying to see. Small adjustment. Saves you a lot of squinting and a few bad reads.
Pick the right instrument. For Indian index traders that means the Nifty future and the Bank Nifty future. The index future is where the real volume concentrates and where institutional flow actually prints. That is the chart that deserves a footprint. Read the flow there first, then decide what to do with it.
Here is where most Indian traders lose before they begin.
Real-time tick data on Indian exchanges is neither free nor automatic. The default feed on most platforms is delayed, often by several minutes. A delay on a daily chart is harmless. A delay on a footprint is poison, because order flow is a real-time read by definition, and a footprint built on stale prints shows you a fight that already finished.
Accurate footprint needs the trade prints and frequent depth snapshots together. Feed it incomplete or late data and it will draw misleading numbers with total confidence. That is the trap. The chart never warns you it is wrong. It just quietly costs you.
To read order flow on Nifty or Bank Nifty futures properly, you need a real-time NSE feed, the kind brokers and data vendors sell, wired into a platform that supports footprint. TradingView on a paid plan with real-time data is one route. Dedicated order flow platforms are another. The platform is a choice you can make later. The real-time feed is not optional. It is the price of entry.
Setup is the easy half. Reading is where people fall apart.
Everyone stares at the delta number and treats it like a buy or sell button. Big green, buy. Big red, sell. The market eats that for breakfast. What matters is delta against price, and delta against the level. Heavy buying while price refuses to move means something is absorbing it. A big move on thin volume is hollow. The number on its own tells you nothing.
The point of control is where the most volume changed hands, the price the market agreed on. Watch it shift from session to session and you are watching the battle move. Imbalances show you where one side gave up. A stack of them in one zone is a fingerprint left in the data.
I will be straight about what is not in this article. The exact conditions I read these together, the calibration that makes a footprint genuinely usable on Indian futures, the way I structure a decision off what I see. None of that goes in a blog post. That part took years to build, and it is the part I teach live, one to one or in a small group. The concept is here. The judgment is taught.
Same mistakes, on repeat.
Running the chart on a delayed feed and trusting the numbers anyway. Reading footprint on the option contract instead of the underlying future, where the liquidity is too thin to mean anything. Treating delta as a signal in isolation. Leaving every setting on the platform default, so the chart shows the wrong resolution for the instrument in front of you. None of these are intelligence problems. They are training problems. Nobody ever showed these traders how the setup connects to the read.
NIC Pro covers the full footprint and order flow method on Indian index futures. Live. The chart setup, the data, the readings, all walked through on real markets, one to one or in a small group, never as a recorded file. Order flow is a skill you build with feedback, not a video you watch once.
If you want to see how I trade it before you commit to anything, I run a free private session most weeks for traders who are serious about learning this properly. You will find the way in at kumarsingh.live.
This is education on a skill and a method of market analysis. It is not advice to trade, and it makes no claim about returns.
Explore the order flow and volume footprint programs
NIC Fundamentals Group Mentorship
Kumar Ravishanker Singh, professionally known as Kumar Singh, is the founder of Kumar Singh Global Trading Academy. All content on this page is for educational purposes around market analysis skills and concepts. It is not investment advice, a recommendation to trade, or a promise of any result. Trading in financial markets carries risk. Make your own decisions or consult a SEBI registered advisor.
Yes. TradingView now has a native volume footprint study that shows bid and ask volume per price level, the delta, the point of control, the value area, and imbalances. It sits on a paid plan. Community scripts exist too, but the ones built on estimated data are far less reliable than a true footprint fed with real-time tick data.
You can, with the right feed. The quality of the footprint depends entirely on the data behind it. For Nifty and Bank Nifty futures you need a real-time NSE feed at tick resolution. On a delayed or standard feed the footprint will still draw, but it will mislead you, because order flow is a real-time read.
In practice, yes. Real-time tick data on Indian exchanges is a paid product, and the default feed on most platforms is delayed. Order flow built on delayed data is unreliable. The feed is the non negotiable part of the setup. The platform you read it on is a secondary choice.
No. That is the entire point of the NIC approach, No Indicator Concepts. A footprint is raw order flow, the actual buying and selling at each price. Indicators are calculated from price that already happened. If you are reading the flow directly, you are already ahead of what an indicator would eventually show you.
The concepts are public. The application is taught live. Kumar Singh covers the full footprint and order flow method inside NIC Pro, one to one or in a small group, with the setup and the readings walked through on live Indian markets. Start at kumarsingh.live and join a free session.